Monday Feb 23, 2026
Monday Feb 23, 2026
Monday, 16 November 2015 00:00 - - {{hitsCtrl.values.hits}}

By Dr. Sirimal Abeyratne, University of Colombo
The newly-elected Government of Sri Lanka has recently adopted price controls on certain consumer goods such as hoppers, plain tea and milk tea. The purpose of this paper (rather the tutorial) is to analyse the economic effects of price controls using economic principles.
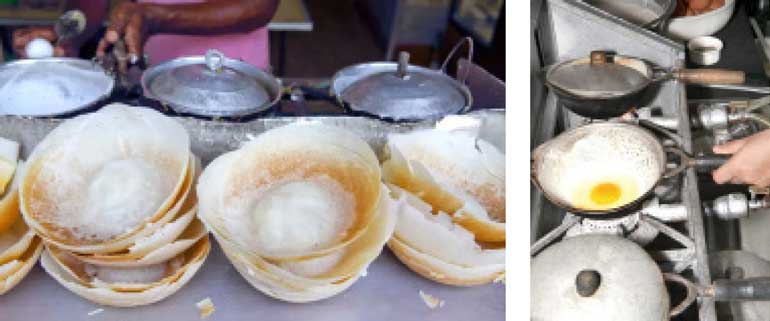
We select the controlled price of hoppers, which is Rs. 10 per plain hopper. Hopper is a common food item of people in Sri Lanka. Its quality varies from place to place, and accordingly, the price varies too:
nRice flour and coconut milk in sufficient quantities are essential raw materials to prepare better quality hoppers; thanks to the Government’s import controls and duties, these both raw materials are relatively expensive in the market. Therefore, the market price of hoppers with better quality is also high.
nPrice of low quality hoppers is lower because they can be prepared by using cheaper substitutes: rice flour can be substituted with wheat flour and coconut milk can be substituted with Plaster of Paris or some other chemicals. Although the mouth can get injured by these hoppers (which look a little different from “glass pieces” in the mouth) and there are other health complications, their lower price is an advantage to low-price conscious consumers.
For the analysis of price controls let us assume that high-quality hoppers are priced at Rs. 20 and low-quality hoppers at Rs. 12. Let us also assume that, therefore, there were two markets for the two types of hoppers, while both markets were operating under competitive conditions. Graph 1 shows the Firm and the Market for high-quality hoppers, and the Graph 2 the Firm and the Market for low-quality hoppers.
As in Graph 1, a competitive firm was producing 50 high-quality hoppers per day; the total market supply of all such firms was 5,000 hoppers at Rs. 20. The controlled price is much lower than their average cost as shown by the gap between the price line and the cost curve of the firm. As a result they are now faced with two choices:
nTo lower the cost by shifting into low-quality hopper production
nTo simply give up hopper production(as some firms may not like to lower the quality)
In either way, there will be no more high-quality hoppers in the market, as shown by the market supply curve with zero supply at Rs. 10.
The story of low-quality hopper producers is different. According to Graph 2, a firm producing low-quality hoppers was supplying 50 hoppers at Rs. 12; in this case too, total market supply was 5,000 hoppers a day. The controlled price (Rs. 10) is not too low for these firms so that they can easily get adjusted to the government policy in two ways:
nTo reduce the quality of hoppers further
nTo reduce the size or weight of the hoppers
This cost adjustment can be shown by a downward shift in cost curves. In either way, the quality of hoppers must go down further. But the story does not end here because there are still some consumers who lost a supply of 5,000 high-quality hoppers (as discussed previously). When they shift their demand also to this market there will be total demand for 10,000 low-quality hoppers. Thus the price controls create a good business opportunity for low-quality hopper producers.
Because there is market expansion for low-quality hopper producers (because of the doubled demand), these firms can further lower their (long-run) costs; this is shown by “downward and rightward” shift in their cost curves, as elaborated in Graph 2, benefiting from the economies of scale. Therefore, each firm can now produce even more, like the firm in the Graph has doubled its production 50 hoppers a day to 100 hoppers.
The above analysis shows how price controls destroy “product development” and retard economic progress of a country, while feeding the consumers with “low-quality” foods. While this is a lesson in Principles of Economics, those students who intend to use this lesson to study for their examinations should also pay attention to short-run and long-run effects of price controls, which was not distinguished here.
