Tuesday Dec 30, 2025
Tuesday Dec 30, 2025
Friday, 14 September 2018 00:00 - - {{hitsCtrl.values.hits}}
Improving hygiene factors are a necessity, but sustainable export growth can be achieved only by building new productive capacities.
Sri Lanka was the 61st largest economy in 2017 according the International Monetary Fund’s (IMF) GDP (PPP) estimates. The Sri Lankan economy was $ 278 billion in GDP (PPP). Immediately preceding and following Sri Lanka were Denmark ($ 284 billion) and Finland ($ 239 billion) respectively.
These three economies are similar in size. 
Does this mean that the three economies are comparable? Not necessarily, as differences between economies go beyond just size.
One of the key aspects that differentiates economies, in relation to export growth and global competitiveness, is ‘productive capabilities.’ Cesar A. Hidalgo, from the Massachusetts Institute of Technology’s (MIT) Media Lab, and Ricardo Hausmann, from Harvard University’s Kennedy School of Government, argue that productive capabilities are all the infrastructure, land, laws, machines, talent, ideas, and collective knowledge that limit what a country can produce and which markets it could to cater to.
Economic complexity as a proxy for productive capacities
Hausmann and Hidalgo established the ‘Economic Complexity Index’ (ECI) as a proxy indicator to indirectly measure the productive capabilities of an economy. ECI takes into account two factors relating to a country’s exports: the degree of diversification of the export basket (diversity) and the number of countries these products are exported to (ubiquity).
ECI has also been validated by Hidalgo and Haussmann as a reliable predictor of a country’s economic growth, especially compared to the generally cited Global Competitiveness Index (GCI) of the World Economic Forum (WEF).
‘The Observatory of Economic Complexity’ of MIT (https://atlas.media.mit.edu/en/) recognises ECI as a measure of the relative “knowledge intensity” of an economy. ECI measures the knowledge intensity of an economy by considering the knowledge intensity of the products it exports. For example, an unprocessed commodity is less “knowledge intensive” than smartphones, locomotives, semi-conductors, and other advanced engineering products. Similar to ECI, the Product Complexity Index (PCI) measures the knowledge intensity of a product by considering the knowledge intensity of its exporters.
Hence, it is argued that high economic complexity is a reflection of export competitiveness, export earning potential, and the capacity to stabilise balance of payment and currency.
Manifestly, lack of “knowledge intensity” among exporters results in a basket of products with limited knowledge embedded in it. Thus, one may argue that the most fundamental determinant of export competitiveness and growth lies in the “knowledge intensity” of exporters.
Figure I shows the GDP (PPP) and ECI of Sri Lanka, Denmark, and Finland.
Despite the economies of Sri Lanka, Denmark and Finland being comparable in size, there is a wide disparity between the “productive capacities” of the three economies, as evidenced by the respective ECI. (Figure 1). Finland is one of the most complex economies in the world with a global ranking of 9, and Denmark is in the top 25. Sri Lanka is way below, ranked 68.
ECI as a predictor of economic growth 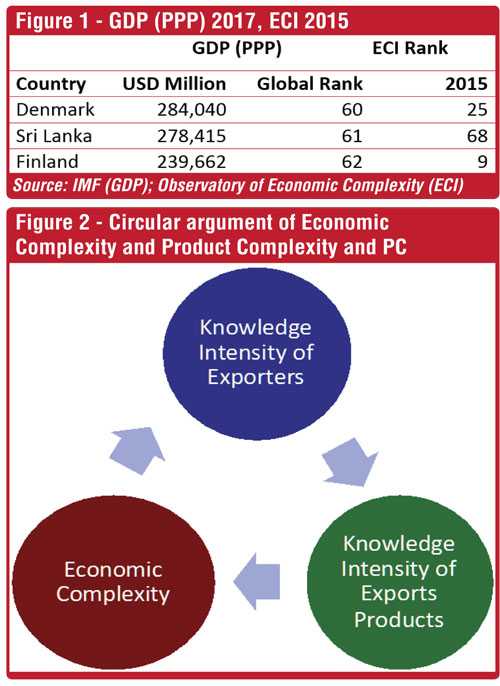
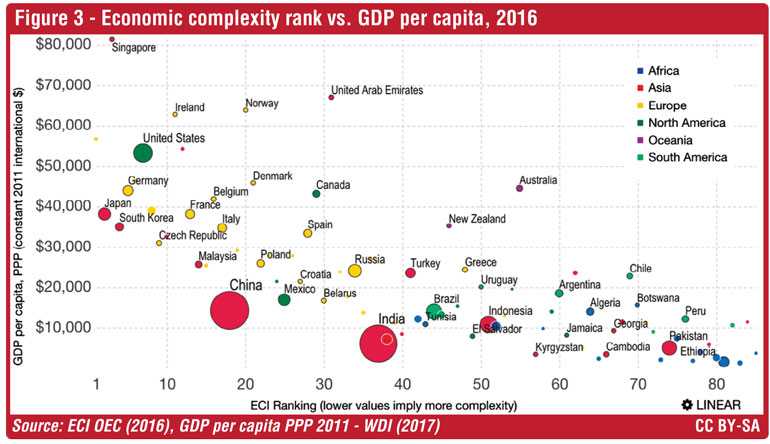
The model developed by Hidalgo and Hausmann shows a strong relationship between ECI and GDP per capita. This means that countries with a high level of economic complexity tend to be affluent, and vice versa.
Figure 3 shows that countries with ECI below ten (Singapore, Switzerland, Germany, United States – between Hong Kong and Switzerland – United Kingdom, Japan, South Korea) enjoy GDP per capita of over $ 30,000. Countries with a low level of economic complexity generally have a low GDP per capita.
Hidalgo and Hausmann also showed that ECI is a predictor of the future growth of economies. Countries with a high level of economic complexity, at a given level of GDP per capita, are expected to grow rapidly compared to low ECI countries.
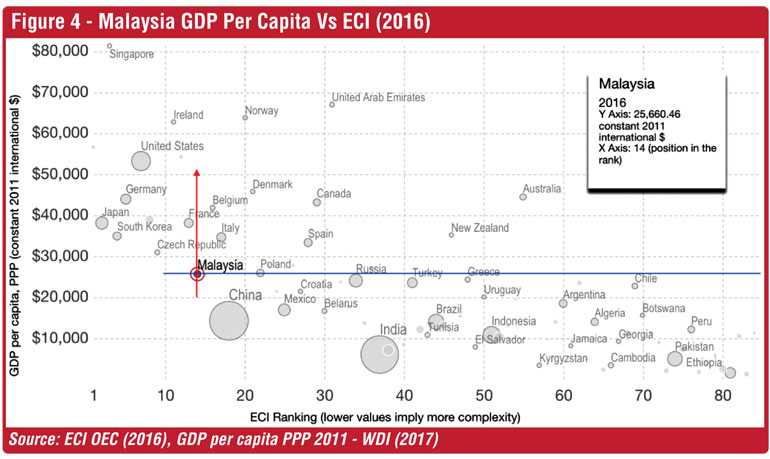
Dr. Esteban Ortiz-Ospina of the Oxford Martin Program on Global Development articulates this for Malaysia.
Malaysia is further left along the horizontal axis than other countries located at a similar level of GDP per capita (see blue horizontal line in Figure 4). Russia, Turkey, Croatia, Poland, and several other counties enjoy a GDP per capita similar to Malaysia, but with much lower “productive capacities.” So, statistically speaking, it is likely that Malaysia will grow faster than these other countries.
Ortiz-Ospina further states, “The intuition for why economic complexity predicts growth can be understood in terms of unexploited productive potential. Countries that are below the income expected from their capability endowment, are countries that will likely shift towards the product-mix that is feasible with their existing capabilities, and which richer countries have already successfully developed.” (https://ourworldindata.org/how-and-why-econ-complexity)
Let’s extend this argument to Malaysia.
Malaysia’s economic complexity is comparable to Ireland, Hong Kong, Belgium, France, and Italy (see vertical red line in figure 4). However, Malaysia has the lowest GDP per capita (PPP) among these countries. That means Malaysia already possesses ‘productive capacities” capable of producing a product-mix similar to more advanced economies. It is fair to infer that the Malaysian economy operates at a level lower than its endowed capabilities are capable of.
Sri Lanka’s Rank in the Economic Complexity Index (ECI)
Let us now compare Sri Lanka’s ECI to regional peers.
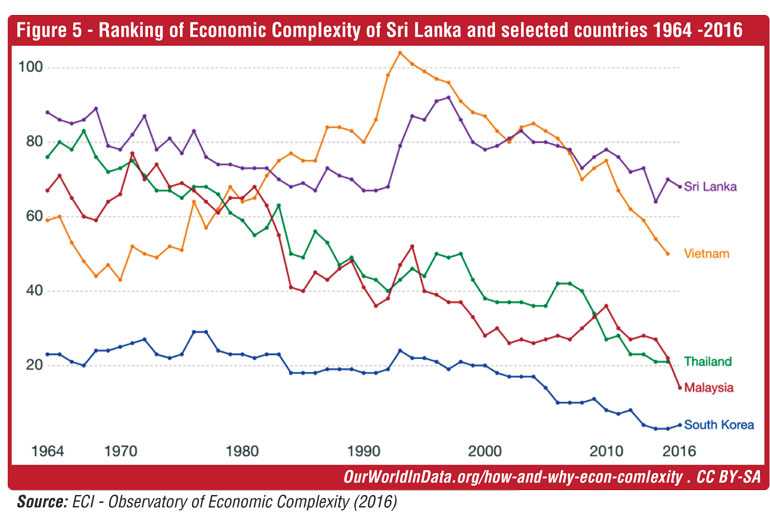
Figure 5 shows how the ECI of Sri Lanka, Thailand, Malaysia, South Korea, and Vietnam changed from 1964 to 2016. (The highest rank of ECI is 1, which corresponds to the country with the most complex economy that year. Hence, the lower the ECI, the more complex an economy is.)
Sri Lanka has been far behind Malaysia, South Korea, Thailand, and Vietnam, except for a brief period in the 1980s and 1990s, when Vietnam was the lowest ranked among the five. Even after the end of the war, Sri Lanka’s performance has failed to achieve an appreciable improvement in ECI.
The rate of increase of economic complexity is highest in Thailand and Malaysia. South Korea, which was well ahead of the other four with a rank of 23 (in 1964), has improved its economic complexity to a very high level and ranked third in the world by 2015.
Sri Lanka’s future prosperity based on current ECI
Is Sri Lanka’s narrative similar to Malaysia’s?
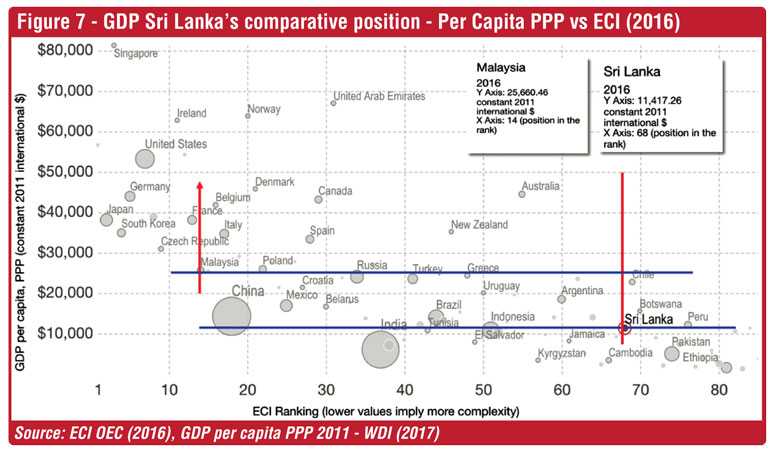
Regrettably not. As illustrated by figure 7, the polar opposite is true for Sri Lanka. Sri Lanka occupies the least admirable segment in figure 6, compared to the rest of the world.
Sri Lanka has the lowest economic complexity compared to most other countries with a similar GDP per capita. Leading the pack are China and Thailand. Other Asian peers ahead of Sri Lanka include Indonesia, India, and the Philippines. Vietnam’s GDP per capita is almost half of Sri Lanka’s, but the country is 20 positions ahead of Sri Lanka in ECI. (Vietnam is not shown in the chart. Its 2015 position is Y Axis: $ 5,667.41, X Axis: 50th ECI position)
In the same ECI class (between the 60th and 70th positions), Argentina, Chile and Botswana have higher GDP per capita (PPP) than Sri Lanka. These three countries are endowed with abundant natural resources and are area-wise many times larger than Sri Lanka.
There isn’t a single industrial advanced economy with an ECI similar to Sri Lanka.
It is fair to postulate that Sri Lanka has probably come closest to the maximum level of development that its present “productive capacities” can deliver.
Unless new “productive capacities” are built, realising the set target of $ 28 billion exports earnings in 2022 could be very challenging. From a broader perspective, there is a real danger of Sri Lanka perpetuating its own “middle-income trap.”
Policy priorities
Improving hygiene factors such as “ease of doing business” and introducing “national single window” is a necessity. However, they are not sufficient conditions for sustainable development and export growth.
Achieving sustainable development and export growth requires building the “productive capabilities” of the economy. Enhancing the “knowledge intensity” of exporters and export products is a primary consideration of policy initiatives.
A fast-tracked accumulation of new knowledge would require: education reforms (the setting up of educational institutions that disseminate new knowledge and skills demanded by today’s global economy), public and private sector investments in research and development, technology transfer through joint ventures and other form of collaborations with foreign companies, and removing barriers to cross border flow of talent, ideas, and capital, among other things.
In summary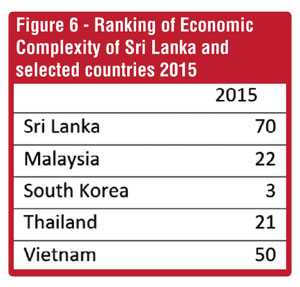
(Lakshaman Bandaranayake has extensive industry experience as a senior corporate executive and a serial entrepreneur. He has nearly 20 years of experience in curating content on economy, industry, and policy on multiple platforms. He can be reached at [email protected].)
Related articles
Further reference