Monday Feb 23, 2026
Monday Feb 23, 2026
Wednesday, 27 January 2021 00:00 - - {{hitsCtrl.values.hits}}
By Ceylon Tea Brokers Plc
The Sri Lankan tea industry for the period January-December 2020 shows an increase in Elevational Averages and a decrease in production and exports when compared to the same period in 2019.
COVID-19 negatively affected industry across the globe. Measures implemented to try and curb the spread of virus disrupted business systems and routines. The tea industry was of no exception from the struggles that the global business market is currently experiencing, restricted product access, lack of the production, loss of income, uncertainty are some of the factors that affected tea industry globally.
Furthermore, macro-economic factors continued to fundamentally challenge the tea industry framework with fluctuations in supply and demand, currencies, political climate in importing countries, policy decisions severely affecting the industry.
Climate change which has a severe impact globally is a factor the industry needs to consider, a decisive factor in agriculture and crop production.
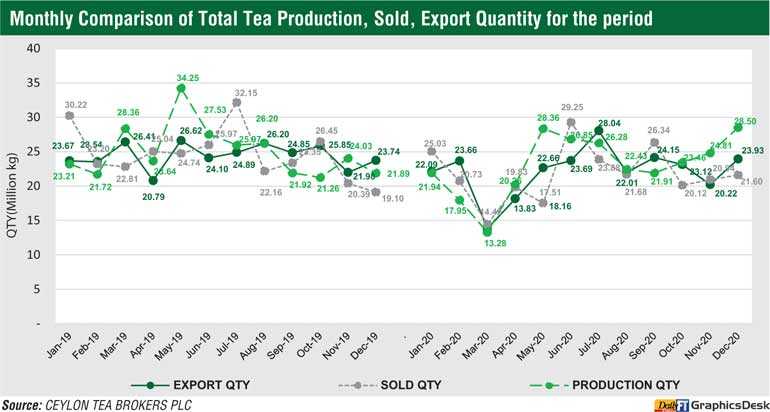
The total tea production of Sri Lankan tea for the year 2020 recorded 278.49 MKgs in comparison to 300.12 MKgs for the same period in 2019 (-21.63 MKgs). High, Medium and Low Growns shows a decline in volume in comparison to 2019.
The CTC High and Medium Grown shows an increase whilst CTC Low Grown shows a decline in volume when compared to the year 2019. Production has decreased by -21.63 MKgs (Lowest since 1997) and when compared to the same period in 2019. Exports have decreased by -27.09 MKgs when compared to the same period in 2019.
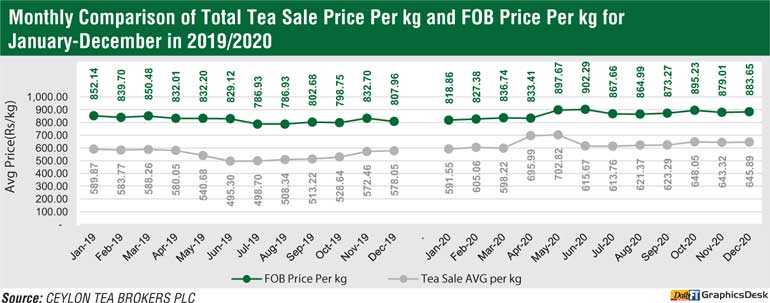
The total national average of teas sold for the year 2020 was Rs. 628.21 (Highest Ever) ($ 3.39) per kilo in comparison to Rs. 544.54 ($ 3.05) (+Rs.83.67) for the same period in 2019. Low Growns averaged Rs. 666.32 (($ 3.59); Mid Growns recorded Rs. 553.94 ($ 2.99) with High Growns at Rs. 580.90 ($ 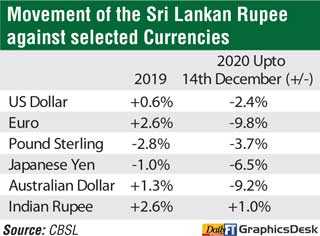 3.13).
The averages for High, Medium and Low Growns in Rupee and Dollar terms, shows an increase for the period January – December 2020 when compared to the same period in year 2019.
Low Growns with the largest market share with 60.94% of the production recorded an increase of (+Rs.89.71), High and Medium Growns recorded an increase of (+Rs.72.27) and (+Rs.84.98) respectively when compared to the corresponding period in the year 2019.
Sri Lanka tea exports for the period January-December 2020 amounted to 265.57 MKgs vis-à-vis 292.66 MKgs recorded for the same period last year (-27.09 MKgs ). The FOB average price per kilo for this period stood at Rs. 866.70 (Highest Ever) in contrast to Rs. 822.25 (+Rs.44.45) when compared to year 2019.
The FOB value of tea bags has dropped in comparison to the same period in 2019 (-Rs.51.42). The total revenue realised for the period January-December from tea exports was Rs. 230.17 b ($ 1.24 b) compared with Rs. 240.64 b ($ 1.35 b) recorded in the year 2019. It’s a decrease in the Rupee terms (-Rs. 10.47 b) and a decrease in Dollar value (-$ 0.11 b) compared to the year 2019. Teas in packets and bulk showed an increase in FOB value YOY.
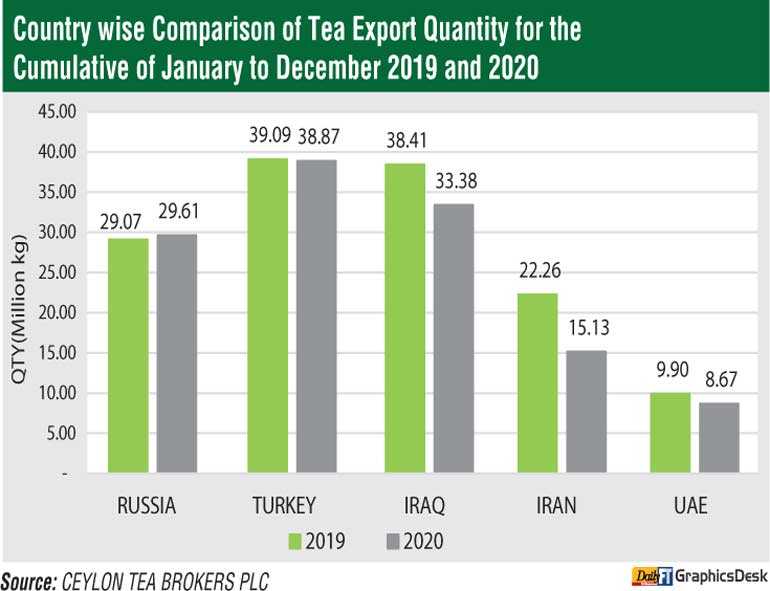
Country wise analysis of exports shows that the Turkey emerged as the largest importer of Sri Lanka tea for the period of January-December 2020 followed by Iraq, Russia and Iran. However, tea exports to Turkey and Iraq have dropped by -0.22 Mn/Kg, -5.03 Mn/Kg respectively compared to the year 2019 whilst tea exports to Russia has increased by 0.54 Mn/Kg. Tea exports to Iran has decreased by -7.14 Mn/Kg. China has increased by +2.25 Mn/Kg, other CIS countries have decreased by -1.66 Mn/Kg, Syria has decreased by -1.45 Mn/Kg whilst Chile has increased by +2.19 Mn/Kg.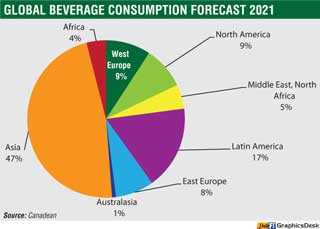
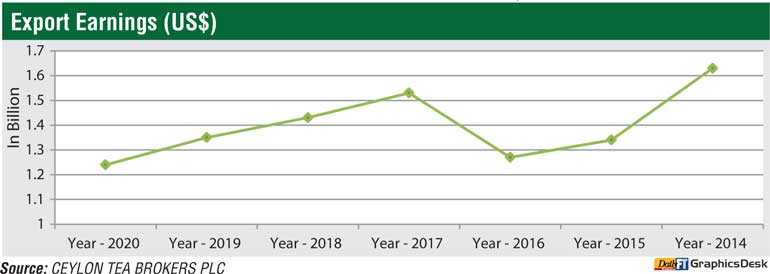
In terms of the US$ equivalent, based on the respective weighted average exchange rates, export earnings amounted to $ 1.24 b in 2020 in comparison to $ 1.35 b in 2019, $ 1.43 b in 2018 with $ 1.53 billion in 2017, $ 1.27 billion in 2016, $ 1.34 billion in 2015 and $ 1.63 billion in 2014.
World economic outlook
The global economic output is recovering from the massive collapse triggered last year by the COVID-19 pandemic but will remain below pre-pandemic trends for a prolonged period. Global output is expected to expand 4% in 2021 and is projected to moderate to 3.8% in 2022, considered down by the pandemic’s lasting damage to potential growth.
Europe and Central Asia
Europe and Central Asia movement in the region is estimated to have fallen by 2.9% in 2020. Due to a recovery of COVID-19, the pace of recovery in 2021 is projected to be slower than originally anticipated, at 3.3%. Growth is projected to accelerate to 3.9% in 2022 as the effects of the pandemic gradually decrease and the recovery in trade and investment gathers momentum.
Economies with strong trade or financial connections to the euro area and those heavily dependent on services and tourism have been hardest hit. The outlook remains highly uncertain, however, and growth could be weaker than expected if external financing conditions tighten, or if geopolitical tensions escalate.
Middle East and North Africa (MENA)
The COVID-19 pandemic has caused deep output losses, on the order of 5% in 2020. Also, significant disruptions related to COVID-19 have been compounded by the sharp fall in oil prices and oil demand. Growth is expected to recover to a modest 2.1% in 2021, as the pandemic is brought under control and lockdown restrictions are eased, global oil demand rises, and policy support continues.
Further, disruptions related to geopolitical tensions and political instability, renewed downward pressure on oil prices, and additional balance of payments stress are key downside risks to the outlook.
US economy
Growth is forecast to recover to 3.5% in 2021 which is 0.5 percentage point lower than previous forecasts. Activity is expected to strengthen in the second half of this year and firm further next year, as improved COVID-19 management assisted by ongoing vaccination allows for an easing of pandemic-control measures. Despite a 3.3% expansion in 2022, output is projected to remain 2.1% below pre-pandemic trends in that year.
The potential for additional economic support and improved pandemic management during the forecast horizon could result in stronger-than expected growth outcomes.
China economy
Growth slow up to an estimated 2% in 2020 – the slowest pace since 1976 but above previous projections, helped by effective control of the pandemic and public investment-led stimulus. The economic policy support, which initially focused on providing relief and boosting public investment, is starting to moderate.
Growth is forecast to pick up to 7.9% in 2021, above previous projections due to the release of unexpressed demand, and moderate to 5.2% in 2022 as deleveraging efforts resume. Even as GDP returns to its pre-pandemic level in 2021, it is still expected to be about 2% below its pre-pandemic projections by 2022, with the crisis highlighting previous exposures and imbalances. (Source: Worldbank.org)
US Dollar
The US Federal Reserve maintained its target for the Federal funds rate at a range of 0% to 0.25% in December, 2020. Also, the Federal Reserve anticipates holding interest rates at current levels until the economy recovers. (Source: Federal Reserve)
Sri Lankan Rupee
The rupee recorded a depreciation of 2.4% against the US Dollar rate up to December 2020.
Global beverage consumption forecast 2021
Asia will account for two-thirds of global incremental beverage consumption by 2021, with China alone responsible for one-third of additional volume. Latin America is expected to achieve the second highest incremental volume growth behind Asia.
Sri Lankan tea production saw a substantial decline in comparison to 300Mn/Kgs in 2019, after a volatile end to 2020 due to the ongoing COVID-19 pandemic.
The year 2021 could be looked at on a more positive note. The world economy is poised for a modest rebound this year. In the year 2020 the world Economic growth being one of the slowest due to the pandemic, the growth in 2021 could be stronger if the pandemic de-escalates, a decline in downturn in major economies, reduced financial disruptions would pave way for a healthier year.
Therefore, a reasonable level of optimism should prevail if all factors affecting growth are reasonably stable.
