Monday Feb 16, 2026
Monday Feb 16, 2026
Tuesday, 19 December 2017 00:00 - - {{hitsCtrl.values.hits}}

By Ceylon Tea Brokers Plc
The third quarter of the Sri Lankan tea industry witnessed a continuation of the upward momentum with increased demand being observed from some of the major importers of Ceylon Tea, especially from Turkey and Russia.
The continuity of the steady rise of the oil prices in the third quarter contributed to a healthier GDP in some of our major tea importing countries where oil is the number one revenue generator.
Whilst the economic outlook for the Middle East region continued to be weighed down by geopolitical risks and structural imbalances across countries, Russia’s gradual economic recovery continued in the third quarter of 2017.
Sri Lanka tea production saw an increase in the third quarter in comparison to the previous year and is likely to surpass 300m kgs by the end of the year.
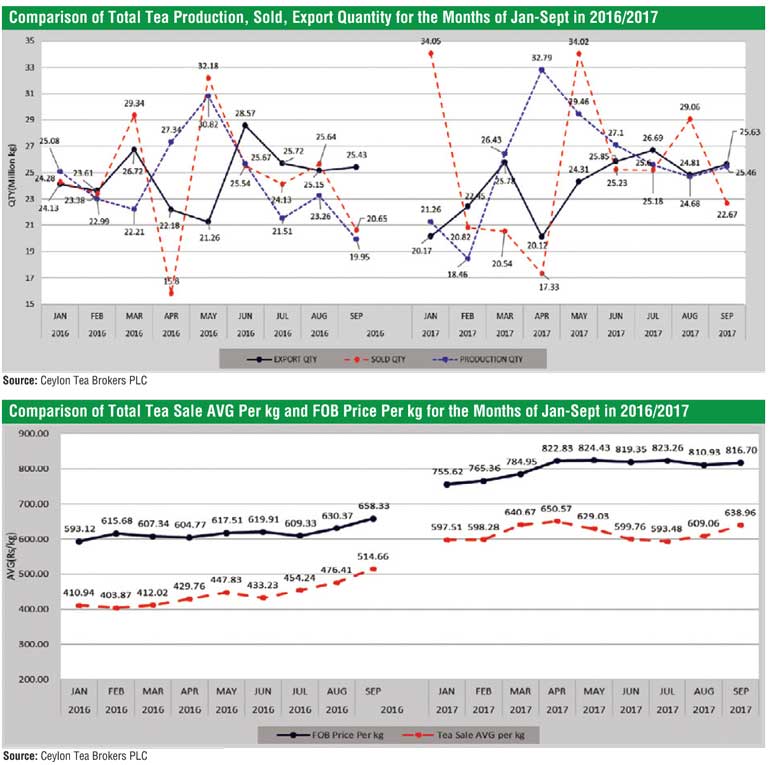
The total Sri Lanka tea production for January-September 2017 recorded 232.56 M Kgs in comparison to 218.98 M Kgs (+13.59 M Kgs) for the same period last year. Production has increased by 13.59 M Kgs and exports have decreased by 6.94 M Kgs compared to the same period in 2016.
The total national average of the teas sold for January-September 2017 was Rs.613.62 in comparison to Rs. 442.08 (+ Rs. 171.54) for the same period last year. Low Growns averaged Rs.635.03, Mid Growns recorded Rs.562.13 with High Growns at Rs.588.93.
The rupee and dollar equivalent averages for Low Grown, Medium Grown and High Grown shows an increase in comparison to the same period in year 2016, 2015 and 2014. Low Grown with the largest market share with 63.64 % of the production recorded the sharpest increase of Rs. 177.09 with the High Growns recording an increase of 162.61 whilst the Medium Grown increased by Rs. 162.06 when compared to year 2016.
Sri Lanka tea exports January-September 2017 amounted to 215.82 M Kgs vis-à-vis 222.75 M Kgs recorded for the same period last year (-6.94 M Kgs). The FOB average price per kilo for this period stood at Rs.803.76 vis-à-vis 617.66 (+186.10) for the same period last year.
The total revenue realised for January-September 2017 from tea exports was Rs.173.47 billion ($ 1.14 b) compared with Rs. 137.58 billion ($ 0.95 b) (+Rs. 35.88 billion) recorded last year. It was an increase in rupee and dollar value compared to the year 2016.
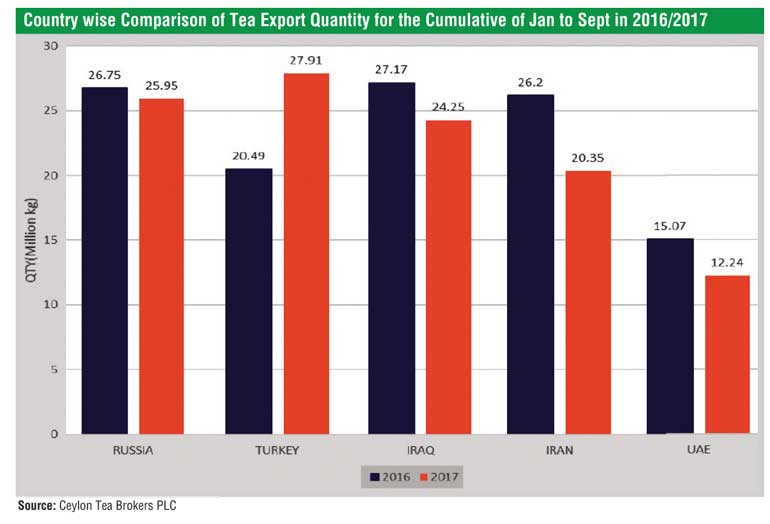
Turkey has emerged as the largest buyer of Sri Lankan tea in the period of January to September 2017 outplacing Russia. Iraq and Iran were recorded as the third and fourth largest importers of Sri Lankan tea for the mentioned period.


Global economic overview
The global economy continued to grow in spite of political risks. The global economy expanded 3.3% annually in the third quarter. The third quarter marked the strongest growth in nearly four years.
The euro economy continues to sail smoothly in the wake of accommodative monetary policies and expanded at the fastest pace in over six years in third quarter.
The Russian economy recovery lost steam in third quarter after growth had shot up in second quarter. Slow industrial output part likely drove the slowdown. The household spending remained buoyant due to rising wages. The Russian economy is expected to grow 1.9% in 2018.
Higher oil prices, resilient global growth and accommodative financial conditions helped cushion Middle East and North Africa’s economic slowdown. The region’s economies expanded 2.1% annually in second quarter. However political instability threatens to derail MENA’s (Middle East and North Africa) economic recovery. The Iran economy continued to expand healthily with GDP expanding 6.5% annually.
The Chinese economy expanded 6.8% annually in third quarter. The economy is expected to lose some momentum in the fourth quarter with manufacturing PMI receding and trade data weakening. The Chinese economy is expected to grow 6.4% in 2018.
US Dollar – The US federal reserve raised interest rates by 0.25 basis points on the 13th of December. This is likely to devalue the SL Rupee against the US Dollar.
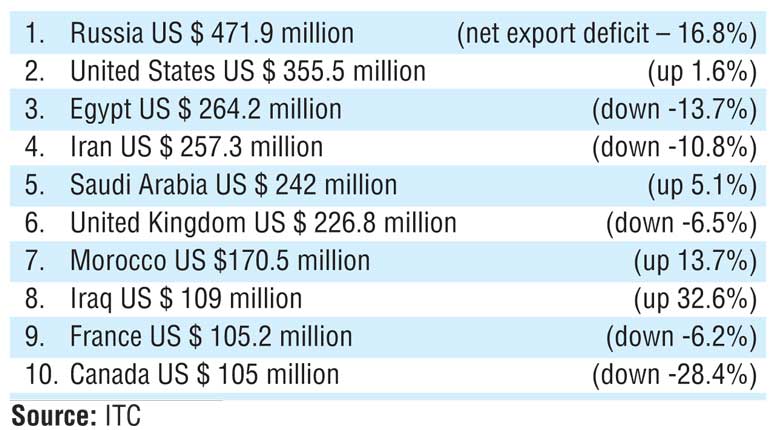
The following countries posted the highest negative net exports for tea during 2016 (the value of a country’s total tea exports minus the value of its total imports)The countries with negative cash flows signal opportunities for tea supplying countries to help satisfy the powerful demand.
The Sri Lankan tea market is expected to remain buoyant due to the global shortfall of crop, devalued rupee and the global economic recovery which would help maintain healthy price structures.
