Thursday Apr 30, 2026
Thursday Apr 30, 2026
Monday, 6 February 2017 10:24 - - {{hitsCtrl.values.hits}}
Overview
Sri Lanka’s external sector recorded a modest performance in October 2016 with deterioration in the trade deficit amidst continued growth in tourist earnings. The trade deficit widened in October as a result of higher import expenditure despite a marginal growth in export earnings. The significant increase in import expenditure in October 2016 was primarily due to the import of a dredger vessel for the Port City construction project. Meanwhile, workers’ remittances were marginally higher while a healthy growth was observed in earnings from tourism during October 2016.
Although inflows to the Colombo Stock Exchange (CSE) and long term loan proceeds to the government supported the financial account of the Balance of Payments (BOP), the government securities market witnessed a net outflow during October 2016.
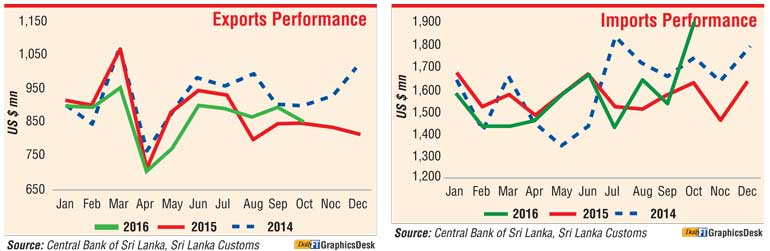
Export performance
Earnings from exports at $ 855 million in October 2016 reflected a marginal growth of 0.9% from $ 847 million in October 2015. Industrial exports, led by machinery and mechanical appliances, petroleum products, rubber products, textile and garments exports, largely contributed to this growth while agricultural exports declined. Earnings from the export of machinery and mechanical appliances increased by 32.6%, year-on-year, in October 2016 mainly due to higher exports of engineering equipment.
Despite the decline in bunkering prices, export earnings from petroleum products increased owing to higher (52%) export volumes of bunker and aviation fuel. Export income from rubber products also showed a growth mainly due to higher earnings from the export of surgical and other gloves as well as rubber tyres. In addition, income from textile and garment exports, which accounts for around 46% of total export earnings, increased by 1.3%, year-on-year, to $392 million, mainly due to the growth in garment exports to non-traditional markets, such as Canada, China, Australia and the UAE, despite a decline in exports to the European Union (EU) market.
Export earnings from tea, which account for about 13% of total exports, however, declined by 9.4%, year-on-year, to $ 108 million, reflecting lower export volumes despite the increase in the average export price by 14.7%, year-on-year, in October 2016. Further, earnings from the export of spices declined by 21.8%, year-on-year, due to lower export volumes of all major spices, including cinnamon.
However, seafood exports to the EU continued their impressive growth for the 5th consecutive month after the lifting of the ban on fisheries exports from Sri Lanka to the EU. Export earnings from seafood increased due to higher prices and volumes, specifically to the EU, which accounts for about 21% of seafood exports.
On a cumulative basis, export earnings during the first ten months of 2016 at $ 8,618 million, contracted by 2.6%, year-on-year, reflecting lower proceeds from transport equipment and petroleum products. Agricultural exports, such as tea and spices, also contributed to the contraction in exports during this period. However, earnings from textile and garment exports, which account for about 48% of total exports, increased during the first 10 months of 2016 due to higher exports to both traditional and non-traditional markets.
The leading markets for merchandise exports of Sri Lanka during the first ten months of 2016 were the USA, the UK, India, Germany and Italy, accounting for about 52% of total exports.
Import performance
Expenditure on imports increased by 16.4%, year-on-year, to $ 1,906 million in October 2016. The increase in expenditure on imports was mainly due to the importation of a dredger vessel by CHEC Port City Colombo Ltd., which was categorised under investment goods. Excluding this, expenditure on imports increased by 5.2%, year-on-year, in October 2016. Import expenditure on intermediate goods and food and beverages increased by 9.6% and 44.1%, respectively, while that on other consumer goods decreased by 25.8%.
The increase in intermediate goods imports was largely driven by the higher import expenditure on textiles and textile articles, gold and fuel. Import expenditure on textiles and textile articles increased by 35.5% due to the increase in import expenditure on fabric. Import expenditure on gold amounted to $ 57 million in October 2016, in comparison to a negligible value recorded in October 2015. Import expenditure on crude oil, refined petroleum and coal increased by 4.5%, 14.4% and 8.1%, respectively.
The import quantities of refined petroleum increased during this month partly reflecting the increase in thermal power generation during the last few months of 2016. The average unit price paid for crude oil and coal increased by 7.0% and 13.0%, respectively, on a year-on-year basis, whereas the average unit price paid for refined petroleum decreased by 6.1% on a year-on-year basis.
Import expenditure on investment goods, excluding the importation of the dredger vessel in October 2016, increased by 8.0% during the month. While most of the sub-components of machinery and equipment increased, the sub-components that recorded a significant increase were engineering equipment and telecommunication devices. Import expenditure on building material increased by 6.3%, year-on-year, with import expenditure on cement increasing by 65.5% and that on articles of iron and steel decreasing by 29.4%. Expenditure on road vehicle imports decreased by 13.9%, mainly owing to the decrease in auto-trishaw imports despite a substantial increase in import of lorries and agricultural-tractors.
Expenditure on consumer goods imports contracted by 6.6%, year-on-year, to $ 377 million in October 2016, with an increase in expenditure on food and beverages and a reduction in expenditure on other consumer goods. The increase in import expenditure on food and beverages was driven mainly by the increase in import volumes and increased prices of sugar. Import expenditure on vegetables, spices, fruits and beverages also increased significantly. The decline in import expenditure on other consumer goods was due to the reduction in the import of personal motor vehicles.
Expenditure on imports at $ 15,852 million during the first 10 months of 2016 increased marginally by 0.2% from the corresponding period of the previous year. On a cumulative basis, import expenditure on food and beverages, other consumer goods and intermediate goods reduced while that on investment goods increased. China, India, Singapore, the UAE and Japan were the main import origins during the first ten months of 2016, accounting for about 58% of total imports.
Trade Balance The trade deficit increased to $ 1,051 million in October 2016 from $ 791 million in October 2015. The cumulative trade deficit during the first ten months of 2016 increased to $ 7,234 million from $ 6,973 million recorded during the same period of 2015.
Earnings from tourism
Tourist arrivals at 150,419 in the month of October 2016 registered a significant year-on-year growth of 13.7%. Tourist arrivals during the first 10 months of 2016 increased by 14.6% to 1,658,824 from 1,448,119 during the corresponding period of 2015. India, China, the UK, Germany and France were the top five sources of tourist arrivals in October 2016. These five countries accounted for 52.4% of total tourist arrivals up to the month of October 2016. Cumulative earnings from tourism increased to $ 2,749.4 million during the first ten months of 20161 from $2,400.1 million recorded during the same period of 2015.
Workers’ remittances
Receipts from workers’ remittances increased marginally by 0.4%, year-on-year, to $ 607.5 million during October 2016 from $ 605.1 million in October 2015. However, cumulative inflows from workers’ remittances during the first ten months of 2016 amounted to $ 5,989.5 million, a growth of 3.5%, in comparison to $ 5,787.3 million in the corresponding period of 2015.
Financial flows
Foreign investments in the CSE recorded a net inflow of $ 8.3 million in October 2016. However, cumulative foreign investments in the CSE during the first ten months of 2016 recorded a net outflow of $ 10.8 million. This included a net outflow of $ 12.2 million from the secondary market and an inflow of $ 1.4 million to the primary market. Foreign investments in the government securities market recorded a net outflow of $ 157.2 million in October 2016.
On a cumulative basis, the net outflow of foreign investments in the government securities market amounted to $ 109.2 million during the first ten months of the year in comparison to a net outflow of $ 1,043.3 million during the corresponding period of 2015. During the first ten months of 2016, the government received long term loans amounting to $ 950.6 million on a net basis, in comparison to a sum of $ 226.2 million received during the first 10 months of 2015.
Overall BOP position
During the first 10 months of 2016, the overall BOP is estimated to have recorded a deficit of $ 273.6 million, in comparison to a deficit of $ 2,337.2 million recorded during the corresponding period of 2015.
International Reserves and Exchange Rate Movements
Sri Lanka’s gross official reserves as at end October 2016 amounted to $ 6.1 billion, equivalent to 3.8 months of imports, while total foreign assets stood at $ 8.5 billion, equivalent to 5.3 months of imports.
The rupee, which depreciated by 3.8% against the US dollar in 2016, recorded a further depreciation of 0.5% from end 2016 to 2 February 2017. Reflecting cross currency movements, the rupee also depreciated against the euro by 2.7%, the pound sterling by 3.5%, the Japanese yen by 3.3%, the Canadian dollar by 3.8%, the Australian dollar by 5.7% and the Indian rupee by 1.2% during this period.

