Tuesday Feb 17, 2026
Tuesday Feb 17, 2026
Monday, 27 June 2016 00:00 - - {{hitsCtrl.values.hits}}
Key points
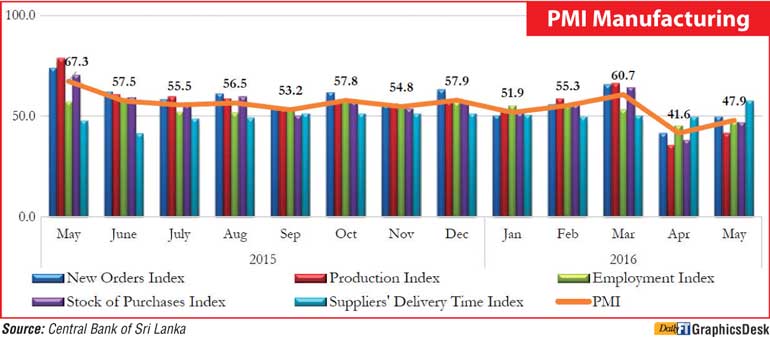
As highlighted by the respondents, this contraction was mainly due to adverse weather conditions prevailed during the last two weeks of May disturbing the overall operations. Factory premises of 29% of the survey respondents were directly affected by flood while others recorded disturbance due to transport issues and employee absenteeism. Nevertheless, the expectations for activities indicated an improvement for the next three months.
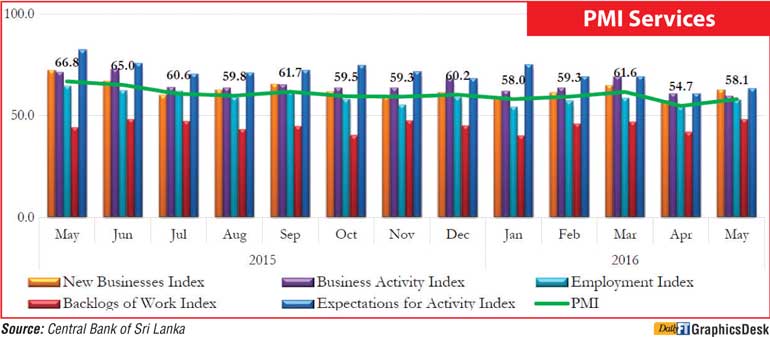
Business activity sub-index, although expanded, slipped down further with the onset of off-season for certain service sector activities, recording the weakest level since the survey began in May 2015. Prices charged increased in May compared to month-on-month decline recorded in April 2016.
Technical Note:
The Index
PMI is calculated as a ‘Diffusion Index’, where it takes values between 0 and 100.
PMI=50 sector remained neutral on month-on-month basis
PMI>50 sector is generally expanding on month-on-month basis
PMI<50 sector is generally declining on month-on-month basis
Sample
The sampling frame was based on a list of large companies located in the Western province obtained from the EPF Department. A random sample of 150 institutions for Manufacturing and 140 institutions for Services were selected based on the GDP sectoral share, with a minimum target of 100 responses for each month.
Definitions of variables
Employment: Number of staff working for the organization
Stock of purchases: Raw materials purchased and kept in a warehouse to be used for production
Supplier delivery time: Time lag between order placement and delivery by the supplier
Backlogs of work: Uncompleted orders due to increased flow of business activity
Other variables are self-explanatory.


