Monday Feb 23, 2026
Monday Feb 23, 2026
Monday, 17 August 2015 00:00 - - {{hitsCtrl.values.hits}}

Sunshine Holdings Group Managing Director
V. Gowindasamy
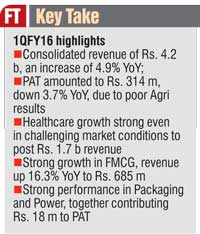
Sunshine Holdings PLC has reported consolidated revenues of Rs. 4.2 b for the quarter ended 30 June 2015 (1QFY16), up 4.9% YoY. PATMI grew 10.8% YoY to stand at Rs. 162 m for 1QFY16, despite a 3.7% YoY contraction in PAT to Rs. 314 m due to weak performance in the Agri sector.
All segments, except for Agri contributed towards top-line growth during 1QFY16. Agri, still the biggest contributor to group revenue (40.3% of group revenue), contracted 10.4% YoY, with Healthcare close behind (39.8% of group revenue) grew 17.5% YoY. Revenue contribution from FMCG increased to 16.4% of total in 1QFY16, against 14.8% during same quarter last year, and grew 16.3% YoY.
For 1QFY16, PAT amounted to Rs. 314 m down 3.7% YoY, but Profit After Tax and Minority Interest (PATMI) was up 10.8% YoY to Rs. 162 m. PAT from both Agri and FMCG sectors has a lower impact on the group PATMI due to lower effective holding. Healthcare still remains the largest contributor to PATMI in 1QFY16 with Rs. 85 m, which represents 52.4% of total PATMI.
Net Asset Value per share increased to Rs. 40.44 as at end 1QFY16, compared to Rs. 39.24 at the beginning of the year (FY15).
Healthcare
Healthcare revenue for 1QFY16 grew 17.5% YoY, exceeding management expectations, and stood at Rs. 1.7 b. This represents 39.8% of Group turnover for the period. EBIT margin for 1QFY16 contracted by 20 bps to 7.5% in 1QFY16mainly on account of bulk diagnostic sales to the Public sector, and supply side pressure from business partners.
The Pharma sub segment which made Rs. 1.1 b in revenues (66.5% of Healthcare revenue) grew 16.7% YoY over 1QFY15, despite a slight contraction in the overall market as reported by IMS. The company’s Pharma segment is the second biggest player in the country with 11.6% share of the market. Growth in other sub sectors were; Surgical (+8.6% YoY), Retail (+12.9% YoY), Diagnostics (+40.6% YoY), Wellness (-1.8% YoY) respectively.
PAT for Healthcare amounted to Rs. 85 m in 1QFY16, up14.3% YoY, but margin contracted to 5.1% in 1QFY16, against 5.3% in the same quarter last year, due to GP margin erosion.
FMCG
The FMCG sector reported revenues of Rs. 685 m in 1QFY16, up 16.3% YoY, on the back of both volume and price growth, and the sector accounts for 16.4% of group revenue for the period. The branded tea business within FMCG sold 703 tons of branded tea, up 8.5% YoY, primarily driven by their largest brand ‘Watawala Tea’ – which is the number one selling tea brand in Sri Lanka.
PAT from the FMCG segment grew 181.7% YoY, to stand at Rs. 82 m in 1QFY16, with a margin of 12.0%, compared to 4.9% in the same period last year. The huge spike in profitability is attributed to a poor 1QFY15 where the segment suffered from lower quantities due to a change in trade compensation scheme, and hence not directly comparable.
Agri-business
The Agri sector represented by Watawala Plantations PLC (WATA) saw its revenue contract by 10.4% YoY to Rs. 1.7 b, on the back of an18.8% YoY contraction in Tea revenue, despite Palm Oil sub sector reporting an increase of 24.4% YoY for 1QFY16.
Agri revenue is below management expectations due to weak market conditions for both Tea and Palm Oil, but this was somewhat cushioned by higher volumes in Palm Oil (+34.7% YoY) resulting from our good agri practices. Volumes for Tea contracted24.8% YoY, by design due to curtailment of bought crop in a declining market.
PAT for 1QFY16 amounted to Rs. 131 m, against Rs. 231 m in the same period last year. The dip in profits can be primarily attributed to Tea, which recorded a net loss of Rs. 137 m for 1QFY16 compared to a profit of Rs. 32 m same quarter last year. 1QFY15 for tea was profitable due to higher market prices, better volumes and favourable weather. However, since mid-2015, Ceylon tea prices have collapsed on account of turmoil in key export markets.
Palm Oil segment which made Rs. 277 m PAT for 1QFY16, continued to be the largest contributor to WATA profits and managed to cover the losses in both Tea and Rubber. Net Selling Average (NSA) for Palm Oil saw a contraction in 1QFY16, in-line with global prices affected by the drop in crude oil.
Other
Packaging revenues amounted to Rs. 95 m, up 13.5% YoY in 1QFY16, against Rs. 84 m in the same period last year. This performance is in-line with management expectations for the segment with the printed sheet business ramping up its contribution to revenue, despite lull sales for both the Tea and Confectionery industry. PAT amounted to Rs. 6 m in 1QFY16 compared to Rs. 391k in 1QFY15 as a result of improved capacity utilisation.
Revenue for the Renewable energy division amounted to Rs. 32 m in 1QFY16, up 110.3% YoY from Rs. 15 m during same quarter last year, due to heavy inter-monsoon rainfall and improved plant and grid stability. The mini-hydro plant, which is in its second year of operation, made PAT of Rs. 13 m for 1QFY16, compared to a loss of Rs. 6 m in the same quarter last year.