Saturday May 02, 2026
Saturday May 02, 2026
Tuesday, 22 October 2019 01:08 - - {{hitsCtrl.values.hits}}
 When I saw the advertisement about an Energy Forum organised by PUCSL for a Policy Dialogue on the importance of an efficient energy sector for economic and investment growth, I was very happy as I have been interested in this relationship for more than 10 years.
It was in December 2011, at a presentation at Organisation of Professional Associations, that I first described how the transport sector operates at 20% efficiency while electricity generation sector operates at nearly 40% efficiency.
Since then I have made numerous presentations on this – at least one is available in You Tube – and analysed energy utilisation efficiencies using Design for Six Sigma Methodologies which were covered in two articles in Daily FT. (www.ft.lk/columns/Paris-Accord-–-Applying-Six-Sigma-methodology-to-solve-climate-change/4-646995; http://www.ft.lk/columns/Making-green-cars-greener---15-b-opportunity-not-to-be-missed/4-651872).
In all these studies, we have used data for USA, and the word “sector” was used the same way it is been used by USA’s Energy Information Administration’s Energy Outlook documents; i.e. to mean individual usage sectors like transport, residential, commercial and industrial. They use the word “source” to mean different energy careers like coal, oil, gas and electricity. I believe PUCSL uses the combination “energy sector” to mean the same thing as what CBSL means in the Table 33 – Performance of Energy Sector in its Annual Report. Then again it includes both electrical energy and energy in fossil fuels.
I believe this understanding was there between PUCSL, panellists and programme coordinator.
I believe constraints analysis used by Millennium Challenge Corporation is a good methodology for analysing this relationship between economic development and other sectoral efficiencies. I am not saying it is perfect and I am already working on how the methodology could be improved.
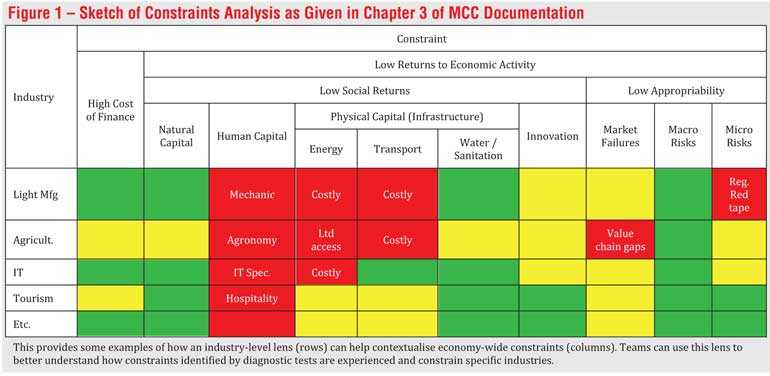
I have taken this Figure 1 depicting the Constraints Analysis framework from chapter 3 of Millennium Compact Corporation document for its grants. It has been based on a much more detailed analysis carried out by Ronald Houseman et al titled “Growth Diagnostics”.
When one looks at this framework, one could see that it could be used to identify how different constraints would influence achievement of development goals.
For this forum emphasis should have been on Economic Growth and Investment Growth in way of objectives and energy sector in way of constraints. I expected the panellists to identify different economic sectors and present their cases for energy efficiency requirements/expectations, what is delivered and short falls.
We could have even used the sectors to which the country’s GDP is broken down in CBSL annual Report. Once this sort of a matrix is developed with the different constraints identified in this matrix, we could identify what are the economic sectors which would be impacted the most by the energy sector.
When I first saw this constraints analysis framework my mind went to the Five Capitals Model with certain changes. I thought I would put the entire climate system with related sinks, resources, processes and parameters within it inside the Natural Capital column.
The physical capitals they have included could mean (i) different sources or sectors of energy, (ii) transport infrastructure and (iii) water infrastructure for drinking, agriculture and other uses. This is basically what US officials would mean by critical infrastructure.
When I was talking about Sri Lanka becoming more vulnerable to climate risk at the forum, I was relating this natural capital and macro risks to either other constraints including energy, or to economic sectors. I strongly believe that we can’t follow a path of economic growth at any cost. In their preface to “Growth diagnostics”, Hausemann, et al say that “analysing constraints does not necessarily make growth diagnostics an advocate of economic growth. Countries should find the trade-offs if any, between growth and other goals through an appropriate political process”. So, these authors clearly mention that economic growth at any cost is not an option. The New Zealand Prime Minister has already started appreciating this.
At the forum, I mentioned a few things about our increasing vulnerability to climate risk – from being the 98th most vulnerable country – as per Munich Re’s rankings – in 2015 to be the fourth most vulnerable in 2016 and the second most vulnerable in 2018. I mentioned that the four reasons why we became so vulnerable are (i) our location close to the equator at 70N thus receiving 400Wm-2 of solar radiation – compared to about 200Wm-2 received by Germany, England, Japan, etc. (ii) large scale air circulation types we experience, (iii) our increasing road density and (iv) greenhouse gases we emit and then the resultant large scale macro risks bringing in million dollar losses to the economy. The last two aspects predominantly result from the two Physical Capital constraints transport infrastructure and energy.
These impacts on natural capital and resulting macro-risks is something we need to pay attention when we consider relationships between sectoral improvements of our economy and contribution of different types of physical capital in model depicted in figure 1. This should have formed the basis of the discussion on energy efficiency’s contribution to economic development.
So, when PUCSL talks about the linkage between energy sector and economic development, they should capture the impact of energy constraints on economic development either directly or through another capital. And because they are constraints or constrained, one could also talk about corresponding efficiencies and that should have been the purpose of the forum.
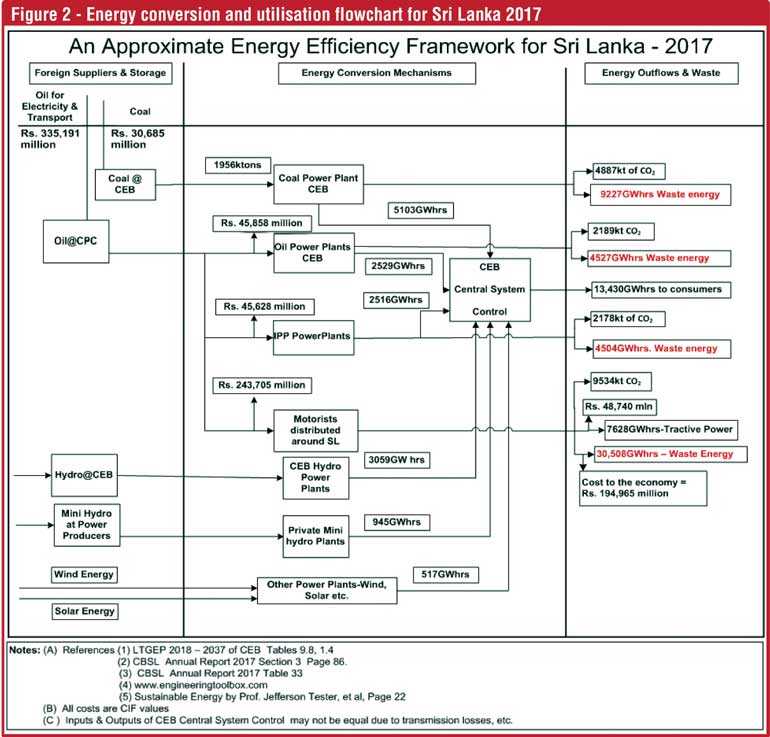
As I mentioned at the forum responding to a question, we have also written to Daily FT (www.ft.lk/columns/If-LTGEP-is-implemented--part-of-Sri-Lanka-will-be-a-desert--An-alternative-lesser-cost-plan/4-656345) giving an energy balance for CEB and transportation sector. See Figure 2.
In this diagram I have assumed that all petroleum driven vehicles operate at 20% efficiency; but some references in the internet indicate that the two-wheel vehicles which form a large fraction of the vehicle population only have an efficiency of about 12%. This would bring about a significant decrease in the overall energy efficiency.
This energy balance diagram depicts two very important factors about Sri Lanka’s energy usage. Firstly, it shows that it is the transport sector which depicts the highest amount, not only of waste energy but also of greenhouse gas emissions. Secondly, it shows that this waste energy from transport sector is more than double the electricity actually used in Sri Lanka.
If you look at the global scenario in 2004- as per IPCC report of 2007- waste energy from transportation in the world was 62.4 EJ and total electricity used was 60.9 EJ. If you look at USA in 2009 – as per Energy Outlook – 2009 document of Energy Information Administration of USA – the waste energy from transport was 13.5 QnBtu and electricity used was 12.9 QnBtu. If you look at 2017 global scenario the waste energy from transport was 24194 TWhrs and electricity used was 25551 TWhrs.
In all these three instances – i.e. Global 2004 and 2017 and USA in 2009 – the electricity used is approximately equal to the waste energy from transport; but in Sri Lanka in 2017, waste energy from transport is more than double the electricity used. So, one could see that it is the most wasteful, therefore the least efficient, energy usage sector in Sri Lanka.
One crucial reason which contributes to this waste of energy in transport sector is the very low – near 20% - efficiency of the internal combustion engine powered automobiles. Please note the Rs. 195 billion annual loss to the economy arising from losses in the transport sector given in Figure 2. Now you can see what hurts our economy the most.
CEB pays the highest price for a kWhr when bought from oil powered generators. Energy efficiency of an oil-fired generator is about 40% - could be even 50% with combined cycle methodologies – and using that electricity to power electric vehicles at 95% efficiency – overall efficiency of 38% - is definitely better for the economy than using oil for transportation directly at 20% efficiency.
In the above treatment we were only talking about rupees and cents of energy efficiency or cost of energy. Use of oil for transportation also contributes to an enormous cost in respect of the Natural Capital and Macro Risks. When it pollutes the environment with products of combustion, it not only enhances CO2 concentration in the atmosphere, but also brings about excessive precipitation and droughts. For every litre of petrol you burn in your vehicle you also emit a litre of water vapour to the atmosphere. I call it Newly Formed Water Vapour as that water did not come from the existing global water cycle.
In fact Munich Re, the reinsurer said that in each of the years 2016 and 2018, 80% the losses incurred by the top 10 most vulnerable countries was due to flooding or water related disasters and only 20% was due to droughts.
So now, one could see how Energy Capital used in Transport Sector – with lowest efficiency in energy utilisation – impacts Natural Capital, feeds atmosphere with CO2 and water vapour enhancing greenhouse gas effect, land surface with high temperatures, droughts due to these gases in the atmosphere, unbearable cyclones, hurricanes, landslides, etc. and thereby influence all types of industries – agriculture in particular – and finally result in macro risks to the extent of millions of dollars which will influence almost all the growth parameters. In summary, this transport sector energy usage is very inefficient and due to this defeats natural capital, macro risks and more than one industrial sector in the overall economy.
I wish the three heads of research entities who participated in the discussion would get their researchers – individually or jointly – study this most crucial energy sector’s efficiency levels adopting appropriate research methodologies and publish their findings. I look forward to study these reports.
Up to now, what we emphasised was how the efficiency of an energy system changes depending on the application of that energy. If energy in oil is used in a power plant, it gives you double the efficiency you get when you use it in a vehicle. When we say that efficiency of energy (in oil) usage in a vehicle is only 20% what we mean is that if 100 units of energy in oil in vehicle’s tank is used, only 20 units of energy will be used for (a) rolling the wheels, (b) overcoming air resistance and (c) overcoming losses due to braking. Balance 80 units is just wasted.
Thermal energy is not the best form of energy to be used in rolling those wheels in an automobile and more efficient form of energy to be used for the purpose is obviously electrical energy and thus the birth of the electric vehicle. But this energy needs to be generated elsewhere and transmitted to the charging station.
So, now we will look at differences in energy efficiencies dependent on the source of energy and routes taken.
In computing efficiency of alternative sources of energy, photovoltaic solar energy will be the winner as it captures energy coming from the sun directly. Any other method will involve many intermediate steps each with less than 100% efficiency. If we want to preserve highest levels of efficiency – basically outputs divided by inputs or factors utilised or compromised – then photovoltaic solar panels installed on a roof will give you a higher level of efficiency over a solar park on an area where another more productive use of the area is compromised.
A still better option or the best option would be to install these PV solar panels above and along a highway as it could not only generate electricity – the positive aspect – but also eliminate the environmental damage due to roadways which is what was captured as one of the four key contributory factors to our becoming the second most vulnerable country.
How roadways make contributions towards this is as follows:
When solar radiation (UV) falls on black surface of a roadway, about 90% of solar radiation is absorbed and surface temperature of roadway goes up. When oceans absorb approximately the same percentage of solar radiation at similar latitudes, surface temperature does not go up so much – due to (a) higher specific heat of water, (b) ocean taking the heat received underneath by conduction – conductivity of water is much higher than that of earth – and (c) ocean taking the heat towards the poles due to oceanic currents – road surfaces cannot move. So, black road surface at higher temperatures emit larger quantities of radiant heat which gets reflected by greenhouse gases in atmosphere. So, when we increase our road density – it is 148km/100km2 to-day and the highest at our latitude and latitude determines how much solar energy falls on roadways – it obviously enhances our climate risk vulnerability.
So, when we lay photovoltaic solar panels above and along roadways it not only generates electricity for BEVs or for grid, but it also prevents solar radiation falling on the highways and saves us from climate risk. As such its efficiency cannot be measured or computed. As such, I emphasise categorically that it is the most efficient source of electricity generation available to-day for a country like Sri Lanka.
If that electricity generated is used for transportation the economic benefit would be very high as we found out that it is in respect of vehicular transportation, we pay the highest price for one kWhr used.
In fact, this is energy capital been generated by human capital using innovation capital in association with transport capital, enhancing natural capital and reducing macro risks and thereby giving birth to a whole heap of opportunities for economic development. Has anybody got a better idea and will the state feed in finance capital to make it happen?
As such this very efficient use of solar energy – a natural capital – for transport would definitely benefit – rather than harm – natural capital, any transportation energy intensive sectors like tourism and also reduce macro risks significantly. Because it will reduce cost of imported fuel for transportation it will also have a significant impact on our economic development and global investors would like to come here and invest in highway solarisation projects. It is our estimate that Sri Lanka has enough roadways which could be solarised to provide energy for 1,750,000 vehicles each doing 15,000km/year and then we talk about $5 billion in investments.
If one were to address how an efficient energy sector could contribute towards economic growth, it is this approach to efficient energy sector which could contribute most to the economic growth. This highway solarisation route to economic development has a whole heap of low hanging fruits. It means manufacture of photovoltaic solar panels, civil engineering related construction, surveying work, electrical work, etc. and all these could go on for a decent period of time.
Then when you talk about battery electric vehicles which is a reasonably new product in the market place, we could get into the supply chain at many points. It could be at producing our own BEVs, component manufacturing, assembling, batteries for BEVs, etc. On the other hand, we could look at conversion of oil driven vehicles using conversion kits and the list will go on.
How these industrial sectors would be influenced by our spectrum of constraints could then be elaborated and evaluated using the Constraints Analysis framework. Such an analysis would throw out vulnerabilities of our economy to different external and internal factors which we could then plan to rectify or exploit.
At least, this is the type of analysis I expected at this forum and not the sumptuous display of food items for consumption which was definitely an act of wasteful expenditure.
So PUCSL, under its present leadership could put a tick against Energy Forum item in its annual calendar of events and feel happy that they conducted a very well attended energy forum addressed by local and foreign energy experts.
How the outcome of the evenings proceedings would influence energy efficiency and thereby economic growth or otherwise in the years ahead could be gauged by the improvements we would see in the energy sector in the years ahead and my judgement is that this forum failed in meeting the expectations of at least some of the participants.
(The writer is Managing Director, Somaratna Consultants Ltd.)

