Monday Feb 16, 2026
Monday Feb 16, 2026
Thursday, 10 April 2025 00:28 - - {{hitsCtrl.values.hits}}

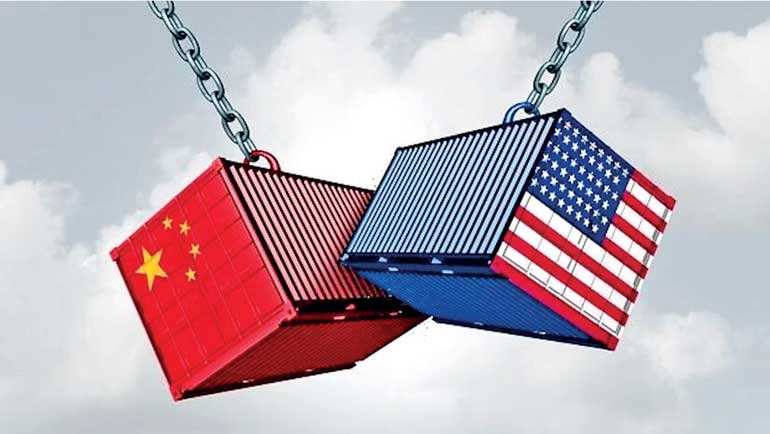
The US-China trade war underscores that while trade conflicts initially appear disruptive, they also stimulate strategic adaptability and resilience
 Introduction
In my previous two articles published in the Daily FT, we explored the immediate impact of President Donald Trump’s 2025 reciprocal tariff regime on Sri Lanka and potential strategies for navigating this economic turbulence. The 44% tariff imposed on Sri Lankan exports to the US, derived from a theoretical 88% reciprocal tariff calculation, has raised critical questions. Many readers reached out, curious about how exactly the US government calculated this strikingly high figure. This article clarifies the math behind that calculation, delves deeply into the lessons from the earlier US-China trade conflict (2018-2019), and provides key insights for Sri Lanka based on how two global giants responded and adapted.
How was the 88% tariff calculated?
First, it is important to understand the math behind Trump’s reciprocal tariff. The US administration applied a standardised formula, explained below, to all countries to arrive at these reciprocal tariffs:
Reciprocal tariff formula:
Reciprocal tariff rate = Trade Deficit / [Elasticity (ε) × Pass-through Rate (φ) × Import Volume]
Here’s what each component means:
Plugging in Sri Lanka’s numbers:
 Calculation:
= 3 billion / (4 x 0.25 x 3.41 billion) = 88%
Thus, the headline reciprocal tariff for Sri Lanka is approximately 88%. Recognising potential economic damage, the actual applied rate was capped at 50% of the calculated reciprocal rate, leading to a final tariff of 44%.
Elasticity and pass-through: Why these numbers?
The elasticity (ε=4) and pass-through (φ=0.25) figures are standardised for all countries, ensuring a consistent and equitable method of tariff calculation. Critics argue this uniform approach doesn’t account for diverse market dynamics, but the administration defends it as an efficient and equitable mechanism. These figures were directly influenced by detailed economic studies from the earlier US-China trade war, offering a realistic yet conservative measure of tariff impacts.
Deep dive: The 2018-2019 US-China trade war
The US-China trade war provides rich lessons on tariff impacts, cost absorption, supply chain resilience, export diversification, and inflation dynamics.
Impact on the United States
Initially, the Trump administration imposed tariffs on approximately $ 360 billion worth of Chinese goods, ranging from electronics and machinery to consumer products. Companies such as Apple, Caterpillar, and Whirlpool initially faced sharp cost increases. For instance, the price of imported washing machines rose approximately 12% within months. However, a detailed study by Cavallo et al. (2021) found only a modest pass-through of tariffs onto consumers, estimating that only about 25% of the tariff increase translated into higher retail prices.
Economic consequences in the US:
Impact on China
China swiftly retaliated, imposing tariffs on roughly $ 110 billion of US exports, targeting soybeans, pork, automobiles, and aerospace products. This strategic retaliation aimed at politically sensitive sectors in the US heartland.
Economic outcomes in China:
Comparative analysis and strategic insights
Corporate responses and cost absorption strategies
Companies across sectors and geographies adapted quickly. Notable examples include:
Global lessons and implications
1.Limited inflation pass-through: One major learning was that tariff-induced inflation remained significantly lower than initially feared. The effective tariff pass-through to consumer prices was minimal, largely absorbed by corporate margins.
2.Export diversification as a necessity: Tariff pressures accelerated diversification of export markets and production locations, underscoring the importance of agility in global supply chains.
3.Technological autonomy: Countries increasingly focused on technological self-reliance. The US-China conflict highlighted vulnerabilities in relying heavily on foreign technologies and components, prompting strategic shifts towards self-sufficient ecosystems.
4.Currency and monetary policy: Strategic currency devaluation and monetary policy easing played a vital role in mitigating export pressures, as demonstrated by China’s targeted interventions.
Implications for Sri Lanka
While not extensively covering strategies for Sri Lanka here (detailed in Part 2), clear lessons emerge:
Conclusion
The US-China trade war underscores that while trade conflicts initially appear disruptive, they also stimulate strategic adaptability and resilience. The reciprocal tariff calculation (88% reduced to 44%) may seem alarming, but historical precedent suggests such shocks can catalyse beneficial shifts in business practices and national strategies.
As Sri Lanka faces this new economic reality, insights from global giants like China and the US can provide invaluable guidance. Proactively absorbing lessons from the past can position Sri Lanka not only to weather the storm but to emerge stronger and more resilient.
References: