Saturday Mar 14, 2026
Saturday Mar 14, 2026
Friday, 5 June 2020 00:20 - - {{hitsCtrl.values.hits}}
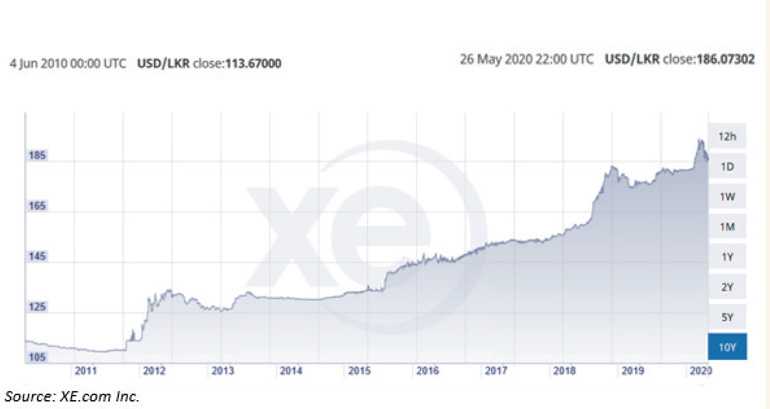
Relative LKR depreciation against the world’s undisputed reserve currency i.e. USD, over the past decade (June 2010-May 2020) attributed to more than 63%. To draw a comparison of this same period to SAARC ally Bangladesh, Taka’s relative depreciation against USD remains at a low 22%.
Whilst the pandemic-caused ripple effects led to the recorded USD/LKR peak spot of 199.75 on 9 April as per CBSL data. Understandably, this led to the USD selling rate crossing Rs. 200 mark for the first time in corresponding dealer markets.
On the global stage, DXY or Dollar Index which acts as an indicative gauge for the USD strength against a basket of six other global currencies (i.e. EUR, YEN, GBP, CAD, SEK and CHF), reached its recent peak of 102 during thr third week of March which was last seen in 4Q 2016 – 1Q 2017 period. As the world’s capital was largely moving towards safer investments (likes of US treasuries) during the pandemic, natural cause-effect path reflected the DXY reaching 100 and beyond index levels since February this year.
In spite of DXY effects, CBSL’s sterilisation efforts in the current year up to April stemming from intervening USD sales nearing 336 million, ably complimented by import demand lax and capital controls have been successful in largely controlling further downward pressure on LKR. Nevertheless, the country’s debacle on defending the LKR against natural market forces continues, with mixed results over the past decade.
Root cause
‘Currency deprecation’ in general remains one of the major challenges faced by developing or emerging market economies. Whilst it may arise due to many intricacies, the significant import-reliance, remains as one of the most critical forces.
To a great extent, the import reliance on scarce commodities (crude) and/or superior industrial products (automobiles) which naturally shows similar traits in developing economies. In Sri Lanka’s context, the above bill (fuel + consumer automobiles) collectively accounted for almost 24% of total imports in 2019 (i.e. $ 4.7 billion).
In essence, imports drive the demand for foreign currency domestically which in turn pressurises the local currency value to edge downwards. Whilst the States may time to time be successful in imposing certain controlling measures to contain the domestic demand for imports and secondarily on means of Forex repatriation, which mostly restricted to short-time bounds.
Further, outflows arising from foreign holdings held in debt (government securities) and capital (i.e. CSE) markets during turbulent times too may reverberate pressures on local currencies. In Sri Lanka’s context, such outflows which recorded their recent highest levels during 2018 (~Rs. 187 billion) and 2019 (~Rs. 66.4 billion) have had roughly accounted for 5% and 2% respectively as against the corresponding annual import costs (i.e. 2018 – Rs. 3.6 trillion and 2019 – Rs. 3.57 trillion).
Considering the relatively lower levels of foreign participation in Sri Lanka’s debt and capital markets, the corresponding shocks arising from such sectors on LKR, assumed to be largely remain manageable even during infrequent stress times.
In this context, it is the general sense that in order to contain or counter this overriding demand for foreign currency in developing economies, the strength and sustainability of foreign currency (Forex) generating avenues become utmost important.
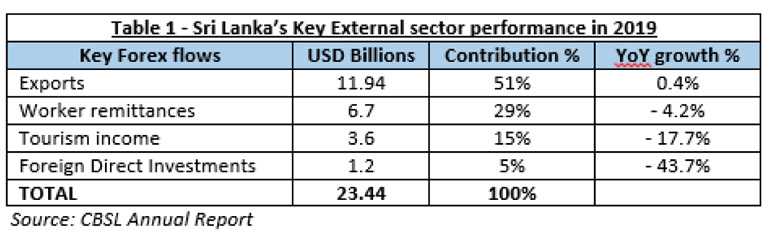
In Sri Lanka’s context if these key Forex generating/inflow avenues to be highlighted, those will fall under the categories seen in table 1.
In essence, the captioned four forces remain as the shock-absorbing cushioning in terms of containing the LKR depreciation to a large extent whilst Foreign debt (~Rs. 6.4 billion and 49% of total national debt as of 2019 FYE) mostly acts as the subsequent void-filler. In the context of contemporary Sri Lankan economy, the more stronger and sustainable captioned forces remain, the lower the incremental impact of foreign debt component going forward.
Moreover, all four Forex income forces which broadly fall under the ‘external sector’ or larger macro-economy, tend to stay more attuned with the market forces than the fiscal side of the economy. This is in effect enables a country to become more financially stable and competitive in the long run.
As per the data in Table 1, exports remain the highest contributor and strongest shock-absorber among the four forces in the long-run survival of the economy. The reason for same is due to the inflows from worker remittance and tourism sector remaining relatively more susceptible to external conditions beyond country’s control (as in the case of current pandemic), than the flows deriving from a competitive exports base.
On the other hand, strong and competitive country exports help to create a thriving industrial ecosystem, entrepreneurship and consequently become an enabler for higher FDIs.
Out of FDIs of $ 1.2 billion flown-in to the country in 2019, BOI based export-led enterprises drew an aggregate of $ 446 million attributing to 37% of total FDI flows (2018 – $ 525 m) proves this point.
In light of above, the following will dig into the current competitive status of Sri Lanka’s exports, criticality of exports for future progress and paths to be followed to make same a reality.
Sri Lanka’s exports – Status quo
As Table 1 points out, exports growth was next to noting during 2019 as it reported only a meagre growth of less than 1% YoY.
Despite the dismal export performance, largely owing to the import contraction during 2019 to $ 19.94 billion from $ 22.23 billion reported a year ago, trade deficit narrowed to $ 8 billion (9.5% of GDP) in 2019 from previously reported $ 10.3 billion (11.7% of GDP).
Criticality
Comparing the decade back status from 2010 and the latest (2019), total Sri Lankan exports in absolute terms have grown only by 38.4%.
In comparison Bangladesh exports for same period were more than doubled from $ 19.23 billion to $ 39.95 billion whilst the country is holding the fastest growing economy in the Asia-Pacific ahead of India.
Sri Lanka exports: Status after a decade
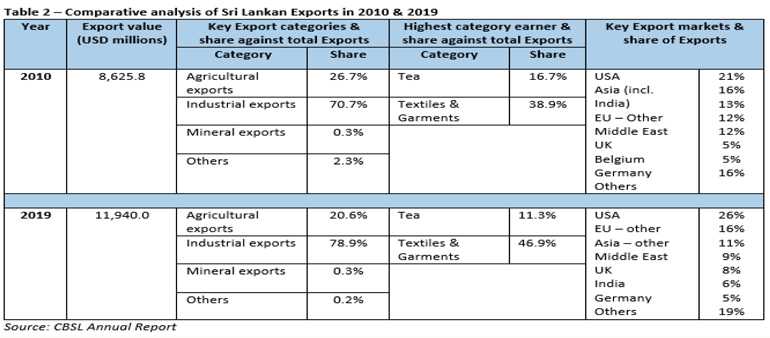
In terms of major export earners, apparel and tea remain the highest contributors. However, the collective contribution of both Apparel and Tea for the overall export income during 2010 and 2019 remain as 55.6% and 58.2% respectively which reflects only a marginal growth in 10 years (table 2). Whilst the share from Tea shows a decline from 16.7% to 11.3%. In turn, signals lack of real impact from export strategies or international relations to promote critical earning sectors.
If contribution from apparel is to be excluded from industrial exports, the income generated from remaining sectors such as rubber and petroleum products, precious stones and jewellery, F&B, tobacco, etc. remain stagnant at 32% of total exports for both periods in 2010 & 2019. This shows, absence of a clear strategy to uplift the industrial business growth/volumes and diversification from apparel.
In terms of key international markets for Sri Lankan exports in 2010 and 2019, the key geographies remain hardly unchanged as shown in Table 2. Even more starkly, despite the historically close ties with neighbouring India, Sri Lanka seems to be missing a real pull-factor to boost the volumes to India as the past decade data suggests (India and Asia export share in 2010 – 16% Vs. 2019 – 17%).
As per a research paper published by the Harvard University in 2018, same denotes that the majority of Sri Lankan exports are dominated by buyer-driven products (mainly apparel, footwear, gems, etc.) and very little export activity from sectors associated with producer-driven networks (such as automobile, aircrafts and/or electronic manufacturing). Sri Lanka’s low share of producer-driven exports suggest a lack of global production sharing which critically highlights the importance of linkages to Global Value Chains (GVC) to make country’s produce more competitive.
Paths for future progress
1.Expansion of non-apparel based industries with special focus towards manufacturing
The industrial-based exports (i.e. apparel, rubber and petroleum products, gems and jewellery, F&B, tobacco, machinery and mechanics, printing products, etc.) accounted for 79% of country’s total exports (i.e. $ 9.4 b) in 2019. Agri and mineral category along with other sectors accounted for the balance 21%. Industrial exports excluding apparel attributed for only 32% of overall exports.
Why industrial-based exports?
To make the country’s exports more-competitive in the global space, earn a premium for ‘Sri Lanka made’ goods and make ‘Sri Lanka made’ mark globally visible. Because after more than seven decades of post-imperial independence, the most visible brands of Sri Lankan origin are restricted to only few, such as ‘Ceylon Tea’, ‘Dilmah’, ‘Spa Ceylon’ and ‘Sri Lanka Tourism’ which again falls under the captioned ‘buyer-driven’ category mentioned under the Harvard research.
Hence the critical focus should be to develop this non-apparel based industrial sector, ideally foraying into more technical-based goods/produce and value-additions. Such an enterprise-ecosystem will eventually bring/promote the following long-term benefits to the country:
Case in point: Bangladesh fast-diversification drive from apparel (presently ranking second in the world) to industrial-exports which has led them to even manufacture electronic robots for South Korea and commercial ships to India starting from 2018. Singapore best-adopted this strategy than any other in recent history, turned from a country with $ 500 per capita in 1965 to $ 13,000 by 1990 thanks to its superior export-led industrialisation.
2.Establishment of new Free Trade Zones
As BOI Investment Guide 2019 suggests, Sri Lanka presently currently has a base of 10 active Economic Processing Zones (EPZ) and two Industrial Parks (IP) accommodating 269 enterprises with a total employment base of 500,000+ and generating nearly 69% of total export revenue in the country. Further, three EPZs in Mawathagama, Bingiriya and Milleniya remain in pipeline.
Benefits currently enjoyed by investors in these EPZs and IPs include 100% foreign ownership, repatriation of earnings/liquidation proceeds, duty exemptions on raw material imports intended for exports, enhanced capital allowance schemes, duty exemptions for capital goods on selective basis and reduced income tax rates starting from 14%.
Next leap of growth
Establishment of Free Trade Zones (FZ) at critically identified business locations ideally closer to few key ports in the country, allowing tax-free business status for investors. In this regard, the successful model pursued by the UAE provides an enabling global example for Sri Lanka as well. Many benefits offered by UAE in this landscape is as follows;
Case in point: UAE based Jabel Ali Free Zone (JAFZA) is considered to be the world’s largest Free Zone as of now. Since 1985, JAFZA operations expanded from 19 companies to a staggering 7,500 entities from over 100 countries which also involves 100 Global 500 companies. JAFZA’s contribution to Dubai GDP as of date stands at almost 24% with an annual trade volume of $ 93 billion.
Bangladesh aggressive plan to develop further 100 new Special Economic Zones by 2025 in addition to its existing base of 88 zones held by both Government and private sectors. Moreover, country is aggressively attracting MNCs (multinationals) in the likes of Honda Corp. in 2018, with the automaker investing on a new 25-acre manufacturing plant in Abdul Monem Economic Zone (AMEZ) in Munshiganj.
Similarly, Singapore which drove export-led industrialisation strategy thanks to its founding father – Lee Kuan Yew, lured best global corporates and MNCs to its doorstep with specially designated 100% tax-free industrial zones, post-independence in 1965.
Whilst the fact remains that Sri Lanka’s prolonged governance lax and lack of national policy pursuance ensuring that the country is achieving little or no-progress on developing this sector for far-too-long period. Meanwhile, countries like Bangladesh with relatively low adult literacy rate of 73% compared to Sri Lanka’s near 93%, has been purposefully driving its national agenda to boost an industrial revolution. So, for Sri Lanka it’s now or never.
Hambantota Port and Colombo International Financial City (similar to DIFC in Dubai, UAE) if developed purposefully would remain catalysts to drive part of this Free Zone trade growth for the future. As of now, the Advantis Free Zone in Katunayake by Hayleys Group remains only such private-investment made in this segment which is a commendable step-forward by the conglomerate.
As the Doing Business Index by World Bank suggests, critical attention should be given to business pre-requisites such as registering property, getting credit, paying taxes, and enforcing contracts which presently carry a relatively lower ranking. For instance, leveraging on country’s existing ICT intellect to rid the bottlenecks associated with the State land registry system and records retrieval in order to make the process digitised, etc.
In view of above, the need for a national agenda is a must to develop this sector speedily and bring-in required investments faster, even by way of private-public partnerships. The State should realise that the strategic location in the Indian ocean alone is not going to bring-in global corporates and MNCs to its doorstep, unless the country resorts to accommodative free-tax regimes (unlike in the case of existing EPZs/IPs located in the country) and incentivise the investors to shift their focus from other peers, towards Sri Lanka.
As mentioned earlier, many benefits to the country in the long run in addition to the natural FDI flows and higher export volumes would include knowledge and tech transfer, local workforce upskilling, opening up avenues for GVC affiliations, local enterprise development, etc. In turn, more akin to Singapore’s success story.
Conclusion
Without a doubt, the development of exports landscape remains the critical salvage-point for Sri Lanka’s many persistent economic fouls including the local currency stability in the long run. Moreover, a bedrock for future economic sustainability as the current status suggests. Moreover, the country’s enabling factors such as high intellect and proven ICT capabilities of the current workforce can be put for better use to expedite this national agenda sooner than later.
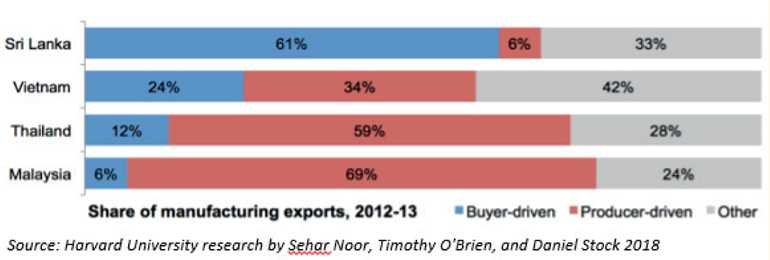
Source: Harvard University research by Sehar Noor, Timothy O’Brien, and Daniel Stock 2018


