Friday Feb 20, 2026
Friday Feb 20, 2026
Tuesday, 20 June 2023 00:01 - - {{hitsCtrl.values.hits}}
 In the last budget, the Sri Lankan Government proposed a new income tax schedule – increasing tax rate and reducing the tax-free income threshold. The proposed changes sparked debate, with many criticising the new rates as excessively burdensome. These taxes were also seen as conditions imposed by the IMF as part of their loan agreement with Sri Lanka. However, the Government maintained that increased tax revenue was essential for improving the country’s financial situation and addressing the debt crisis. To date, no comprehensive study has assessed the appropriate level of personal income taxes in the country.
Therefore, this article aims to explore personal income taxes in Sri Lanka. In doing so, the article will question the necessity of income taxes, the problems associated with it and more importantly identify the optimal income tax rate and income tax exemption threshold needed to ensure a fair and welfare-maximising tax system in Sri Lanka.
Why are taxes needed?
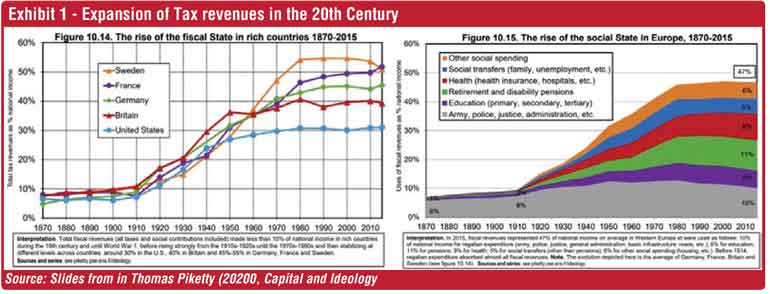
Prior to the 20th century, taxes were primarily used by governments to finance military expenditure and provide basic infrastructure. In the early 1900s, government tax revenues in OECD countries were around 10% of the GDP (Piketty & Saez, 2012). At this time, most countries had minimal investments in education and healthcare systems. By the 1950s, tax revenues had increased significantly, reaching an average of 40% of GDP in OECD countries (see Exhibit 1). This growth in tax revenue allowed governments to invest in health, education, and social protection programs, contributing to economic development. Investments in human capital is a crucial factor in the overall development of a country. In fact, growth in modern economies is mostly driven by human capital improvements (Lucas, 1988).
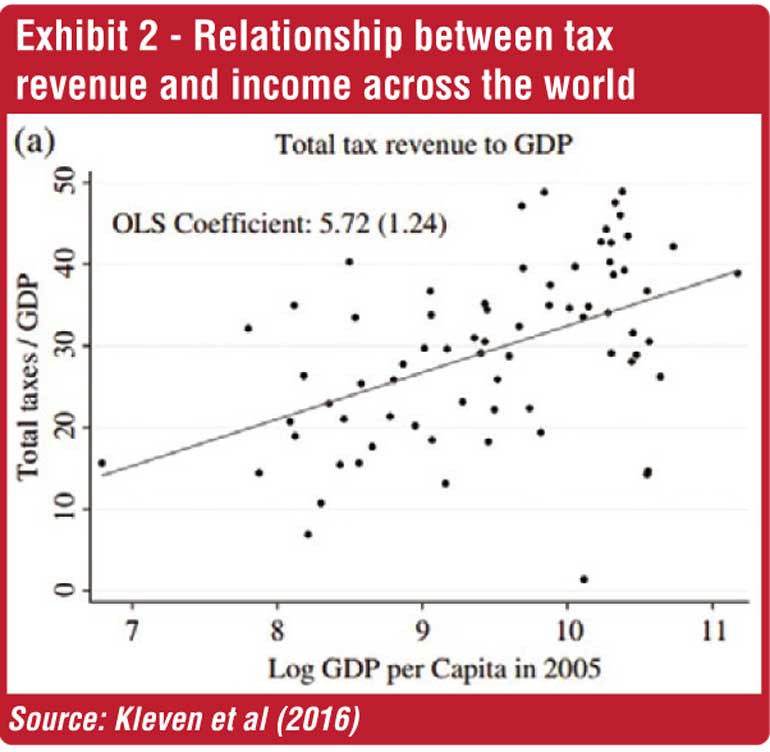
Recent studies have demonstrated a positive relationship between a country’s income and tax revenue a as share of its GDP. Kleven et al. (2016) found that countries with higher GDP per capita tend to collect a higher tax revenue as a share of GDP (see Exhibit 2). Similarly, Besley and Persson (2013) observed from a sample of 18 high-income countries how the tax to GDP increased with an increase in GDP per capita over time from 1900 to 1999. Currently, the tax revenue collected (share of GDP) in today’s developing countries is similar to the tax revenue collected in the advanced countries 100 years ago. Hence, it could be argued that improvements in tax revenue 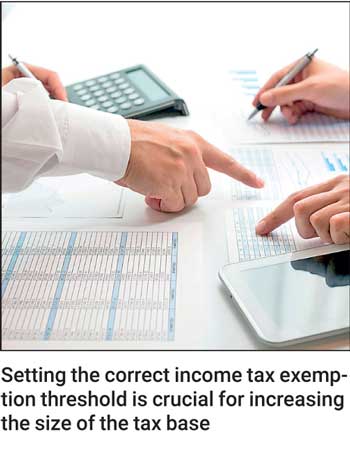 can increase a country’s income. (It could also be argued that higher income lead to better tax collection.)
Tax revenue serves a number of important functions for governments, in addition to aiding the development process. First, it improves the standards of governmental institutions, enabling them to offer citizens better service. Second, increased tax revenue strengthens the government’s capacity to regulate the market economy and enforce the rule of law. Third, tax revenue can be used to assist vulnerable populations. However, for the nation to gain from higher tax revenues, it is crucial to ensure that the government uses the money collected through taxes in the most efficient manner, free of corruption, and with sound management of public funds.
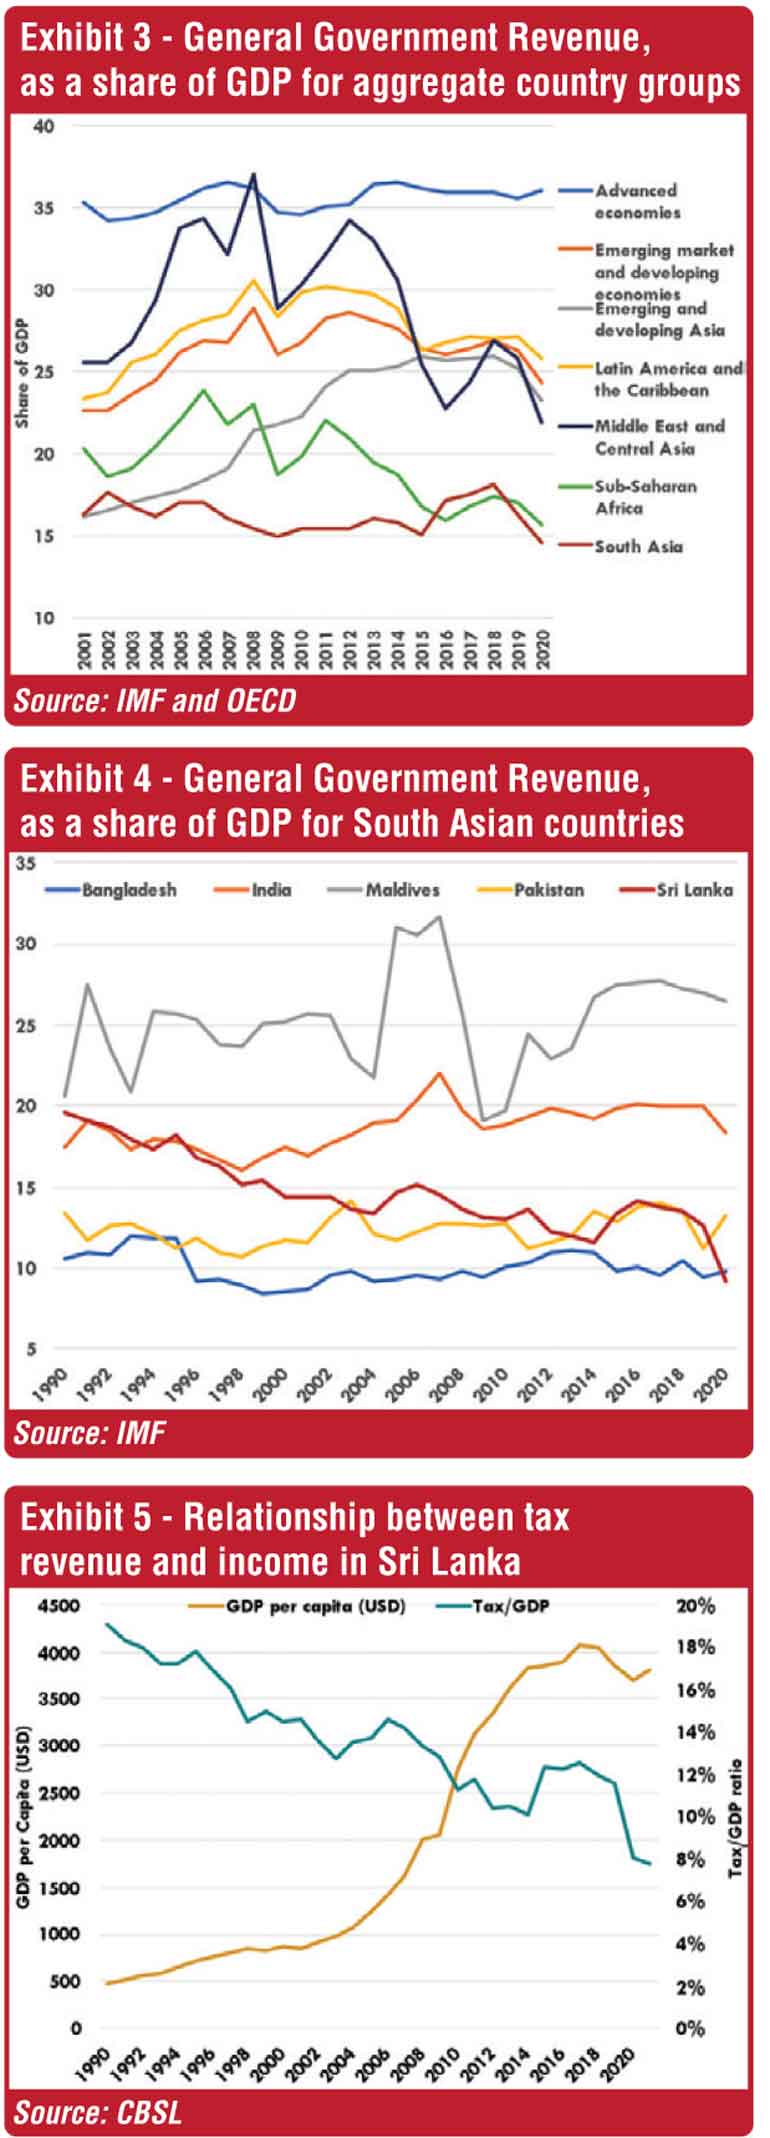
Currently, wealthier countries collect a larger share of their GDP as taxes. For instance, advanced economies have an average government revenue of approximately 36% in 2020 (see Exhibit 3). Countries such as France and Denmark collect nearly half of their gross domestic product (GDP) as government revenue. In contrast, South Asia (Sri Lanka, India, Bangladesh, Pakistan, and the Maldives) has the world’s lowest government revenue as a share of GDP at 15.4% in 2020, which is slightly below Sub-Saharan Africa’s 15.6%.
According to IMF data, Sri Lanka has the lowest government revenue among South Asian countries, amounting to only 9.1% of its GDP in 2020 (see Exhibit 4). Furthermore, Sri Lanka’s tax revenue as a percentage of GDP decreased over time (see Exhibit 5). It was 19% of GDP in 1990 but dropped to 7.7% by 2021. In the meantime, there was an eight-fold increase in the country’s income during the same period. This contrasts with the globally observed positive relationship between tax collection and a country’s income.
Furthermore, in Sri Lanka, the majority of past developments were fuelled by debt. As a result, the Government experienced a serious debt crisis. This crisis was mainly due to the country’s inability to generate sufficient revenue to cover its expenditure. The fiscal deficit in 2021 is 1.4 times the amount of government revenue collected. Thus, increasing tax revenue is critical to reducing the deficit and improving the debt-to-income ratio.
Why do income taxes matter?
Income taxes are often preferred to commodities and other taxes for two primary reasons. First, income taxes are less likely to distort the market, as taxes on commodities can lead to the overconsumption of some products and underconsumption of others, depending on the tax rates. Inconsistencies in tax rates across products can discourage consumers from purchasing certain products. Trade taxes, which Sri Lanka heavily relies on, amounting to almost half of the tax revenue, can reduce the trade competitiveness of the country (Publicfinance.lk, 2020).
Second, income taxes are considered more progressive as they are based on an individual’s ability to pay. Theoretically, the most efficient way of collecting taxes is to charge lump-sum taxes on all individuals equally (Stiglitz & Rosengard, 2015). Everyone would be charged the same amount of tax, regardless of their income or consumption patterns. Hence, there are no distortions in any incentives to consume or work. However, it places a disproportionate burden on lower-income individuals. Individuals with higher income are often considered to have a greater ability to pay taxes than compared to those with lower income. As ability cannot be measured directly, income is used as a proxy to measure it. Other factors, such as family background and luck can also contribute to an individual’s income. Therefore, using income as a basis for taxation is the common practice.
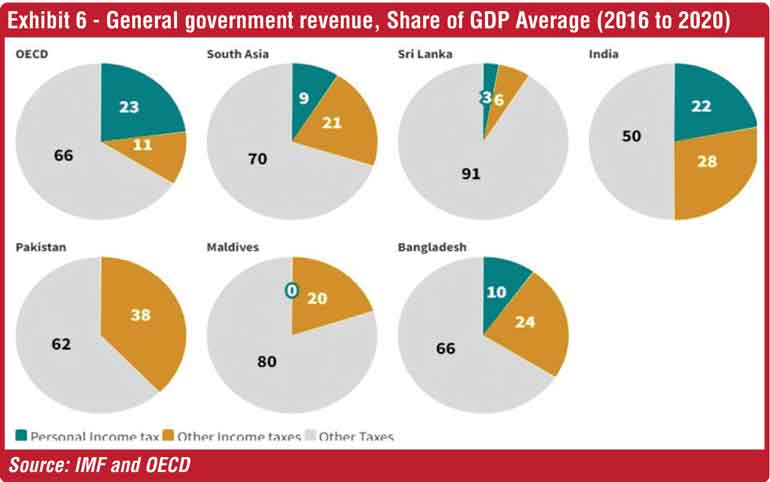
Globally, high-income countries collect a large proportion of their government revenue through income taxes. For example, OECD countries, collect the largest proportion of their taxes through Personal Income taxes amounting to 23% of the total tax revenue (see Exhibit 6). India collects 22% of its central government’s revenue in personal income taxes. As of 2020, Sri Lanka collects only 3% of its revenue through income taxes.
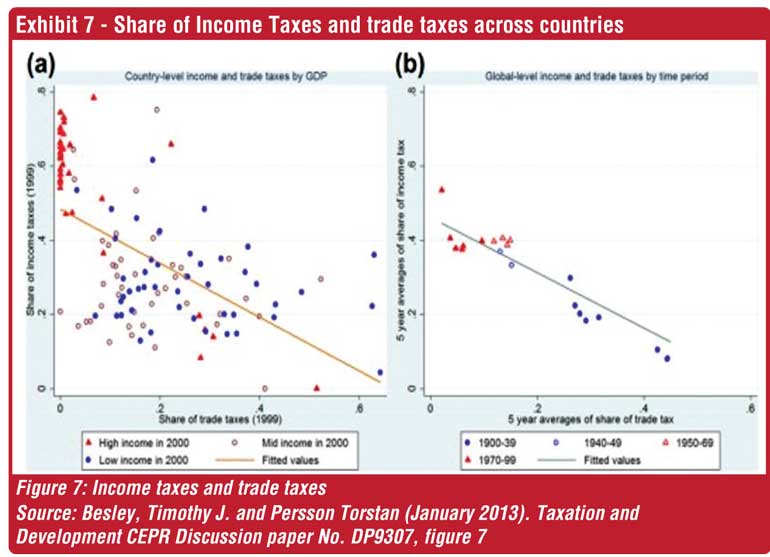
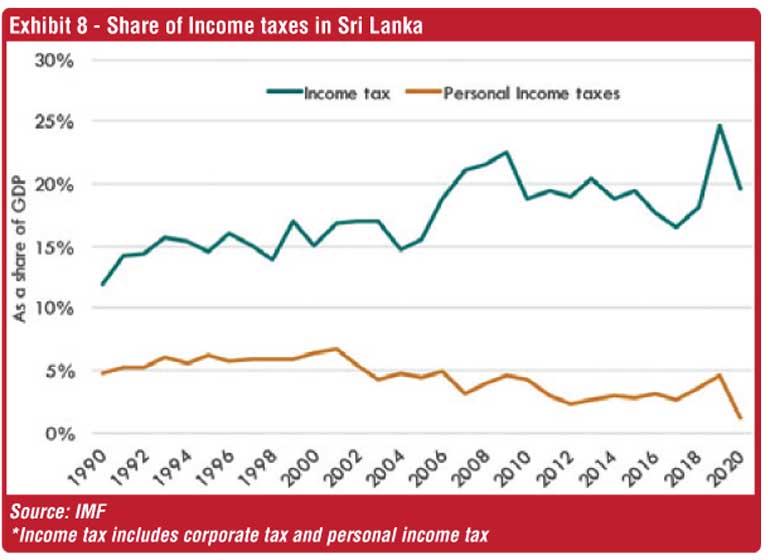
Research has shown that income tax collection usually increases with increase in a country’s income. For example, Besley and Persson (2013) show that the share of income taxes in total tax revenue increases with an increase in the GDP per capita of the country (see Exhibit 7). While the share of trade taxes reduces with income. The prominence of income taxes has particularly increased with increase in income mainly due to the improved fiscal capacity of the governments to tax them at source. Over the past three decades, Sri Lanka’s share of personal income tax has decreased from 5% to 3%, despite an overall increase in the country’s income (see Exhibit 8). This finding suggests a lack of progress in the collection of personal income taxes.
To address the above issue, Sri Lanka must place significant emphasis on augmenting its revenue through personal income taxes. There are two primary methods to achieve this. Firstly, by raising the tax rate, and secondly, by expanding the tax base through the inclusion of a larger proportion of the workforce. The tax base can be increased with a lower income tax exemption threshold. Higher-income countries typically Exhibit both a higher tax rate and a more extensive tax base, resulting in an increased tax revenue collection compared to their lower-income counterparts. However, it is important to note that both of these actions come with their own set of challenges.
What are the problems of income taxes?
The main argument against personal income taxes in a country is often that it reduces individual incentives to work. An increase in the tax rate beyond a certain point, decreases tax revenues as there is less incentives to work and invest. However, it is also necessary to ensure that those with greater ability or income contribute to a fair share of funding public goods and services. Therefore, it is essential to find the right balance between taxing individuals fairly while maintaining incentives for work and investment. This is called the equity-efficiency trade-off in income taxation. The theory on optimal income taxation deals with how best to maintain this balance (details in the next section).
Another significant challenge of collecting income taxes, especially in developing countries, is the government’s difficulty in identifying the sources of citizens’ income. This creates several issues, including tax evasion, as some individuals may underreport their income or engage in other forms of tax avoidance to evade paying tax. The collection of personal income taxes can also be time-consuming and expensive for both taxpayers and the government as they need to obtain the necessary legal, and accounting advice on tax compliance. Measuring an individual’s income accurately can also be challenging, particularly for those who earn income from multiple sources or receive nonmonetary compensation.
Advanced economies can collect more income taxes because they rely on widespread third-party reporting of income. In these countries, most taxes are collected through third-party institutions such as employers, banks, investment funds, and pension funds. Even in advanced economies, tax enforcement is weak in the absence of third party reporting. For example, a study by the US Internal Revenue Service found a high rate of tax evasion of 56% when there was “little or no” information reporting, compared to only 5% evasion when substantial information reporting was present. Empirical studies also show that third-party information reporting is critical for tax enforcement in developing countries. (Kleven et al., 2016).
Therefore, enforcing the collection of personal income taxes is a challenging and costly task, particularly when a significant portion of the workforce comprises those working on their own in the informal sector (i.e. self-employed individuals). On the other hand, enforcing taxes on employees in the formal sector is relatively easier, as third-party agents can simply provide necessary information.
Other concerns usually raised, such as taxation leading to lower disposable income, do not have merit in this analysis. When considering the aggregate income of a country, taxes do not necessarily reduce the overall income. Rather, the government uses tax revenue to spend it back into the economy. Income taxes, specifically progressive ones, only has distribution effects in an economy. People with higher incomes will contribute more than those with lower incomes. This is essential in Sri Lanka because the majority of tax revenue is currently collected through indirect taxation of the overall population. Further, in Sri Lanka, it is important to note that immediate beneficial effects on spending may not be readily apparent to citizens, as the government may use tax revenue to reduce the budget deficit and prevent debt levels from rising. This is a necessary step for the country, as maintaining high levels of deficit is not a sustainable solution.
Therefore, the existence of self-employed workers in the informal sector and the disincentive to work due to taxes can significantly impede a state’s tax revenue collection. Thus, it is imperative to optimise two critical variables of labour income tax, the tax rate and the tax-free income threshold, in a way that maximises a country’s welfare. The next section explores the optimal income tax rate and optimal income tax exemption threshold for Sri Lanka.
What is the optimal tax rate?
The optimal labour income taxation theory (Mirrlees, 1971) suggests that the government should impose taxes on labour income in a way that maximises social welfare. This means that the tax system should balance the equity-efficiency tradeoff by considering the impact of taxes on income distribution and economic incentives. The theory suggests that the optimal tax rate should be set such that it does not discourage individual s from working or investing, but at the same time, it should generate sufficient revenue for the government to provide public goods and services.
The literature on optimal labour income taxation is extensive and technical. Therefore, I focus mainly on the results of these theories without going too deeply into technicalities. Assuming a utilitarian welfare function, the optimal tax rate, derived based on an optimisation problem, mainly depends on the elasticity of labour supply to taxation. A larger elasticity means that an individual is less likely to work more hours with an increase in marginal tax rates.
Using a more realistic elasticity of 0.25 (obtained based on empirical studies), Piketty and Saez (2013) estimated the optimal income tax rate to be 61% (assuming the tax rate is flat across all income levels). This means that, the country’s welfare will be maximised when 61% of the labour income is taxed. This number may seem overstated and unrealistic, given the lower levels of tax in Sri Lanka. However, there are advanced countries such as France and Denmark which collected around 47% of their GDP in taxes in 2019 (European Commission, 2020). During the 1960s, the UK and the USA also charged a 90% marginal tax on their top income bracket.
Further, even assuming an elasticity of 1 (one estimate Indraratna (2009) calculates Sri Lanka’s income tax elasticity to be around 0.76 to 0.78 in the long run), the corresponding optimal income tax rate is 36%. Currently, Sri Lanka’s average income tax rate is 21%. The weighted average rate could be further low, as most of the income taxpayers are around the lower income brackets.
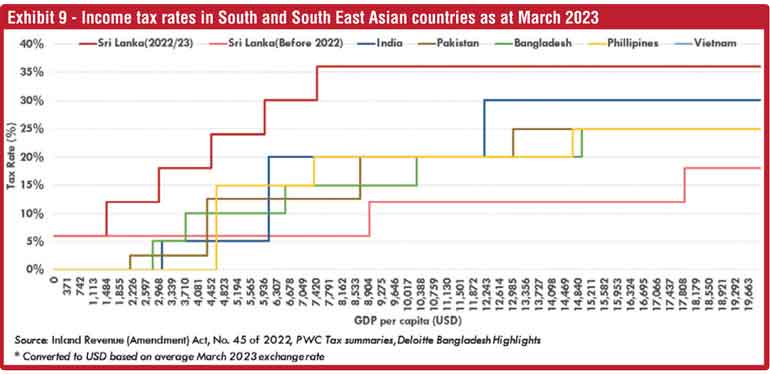
A comparison between the income peers in South and Southeast Asia shows that the current tax rates are higher for Sri Lanka (see Exhibit 9). It is also important to note that the previous rate was too low, as Sri Lanka had the lowest rate among these countries.
What is the optimal income tax exemption threshold level?
Setting the correct income tax exemption threshold is crucial for increasing the size of the tax base (the proportion of the population liable to pay taxes). Maintaining the income threshold at a lower level increases the country’s tax base. For example, Piketty and Qian (2010) show that
China was able to increase its tax base, which only covered 0.1% of all wage earners in 1986 to
44.1% in 2003, mainly due to not raising the income tax exemption threshold regularly. In contrast, India increased its exemption threshold frequently, in line with inflation, and was able to increase its tax base from 0.7% in 1986 to 3.8% in 2001.
Using data from across countries and across US States, Jensen (2022) shows there is a close relationship between the tax base size and tax collection. Increasing the tax base from less than 10% to more than 90% increases the income tax collection from 1-2% of GDP to 15-18% of GDP. Before 2022, income taxes covered only the top 5% of the population in Sri Lanka. Even the current income tax covers only the top 20-30% of the population. Hence, it is important to increase the tax base in Sri Lanka, to collect more income tax as a share of GDP. However, as mentioned in the previous section, maintaining a lower income threshold is administratively costly. Most people in lower-income brackets are self-employed individuals in the informal sector. Therefore, it is less costly to tax higher-income groups that consist of a larger share of employees, as opposed to self-employed workers.
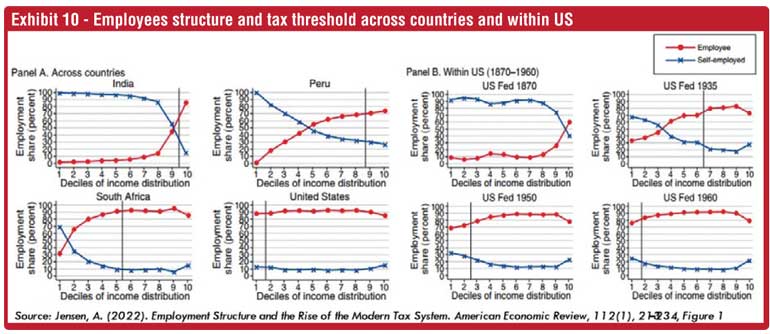
Jensen (2022) shows that the expansion of the modern tax system in advanced economies was primarily due to the government taxing a larger share of employees in a particular income group. In the early stages of a country’s development, the employee share of the population is concentrated mostly at the top end of the income distribution, and the income tax exemption threshold is set at the highest income level. As income levels rise, the employee share of the population increases at lower income levels and the threshold gradually reduces over time. (See panel b of Exhibit 10 on how the threshold changed over time for the US). This reduction in the threshold led to an expansion of the income tax base for advanced economies. On average, the tax-free income threshold is set to cover 85% to 95% of the employee share in the income bracket. (See panel A of Exhibit 10 for different threshold levels for countries at different development stages).
(The writer is an Economics student at LMU Munich, Germany and former analyst in macroeconomics and public finance at Verité Research, Sri Lanka.)
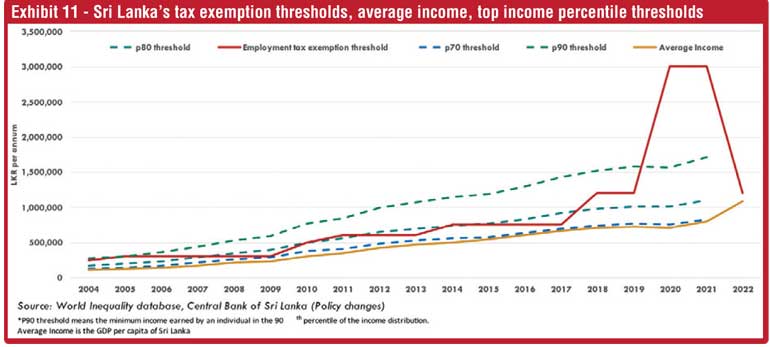
In Sri Lanka, prior to 2017, the income tax exemption threshold for employees was set between the 70th and 80th percentiles of income distribution (Exhibit 11). This means that only the top 20–30% of income earners were required to pay income tax. With the introduction of the new Inland Revenue Act in 2018, this threshold was raised above the 80th percentile. In 2020, it was further increased to above the 95th percentile. However, the 2022 revision brought the threshold back to its previous range between the 70th and 80th percentiles.
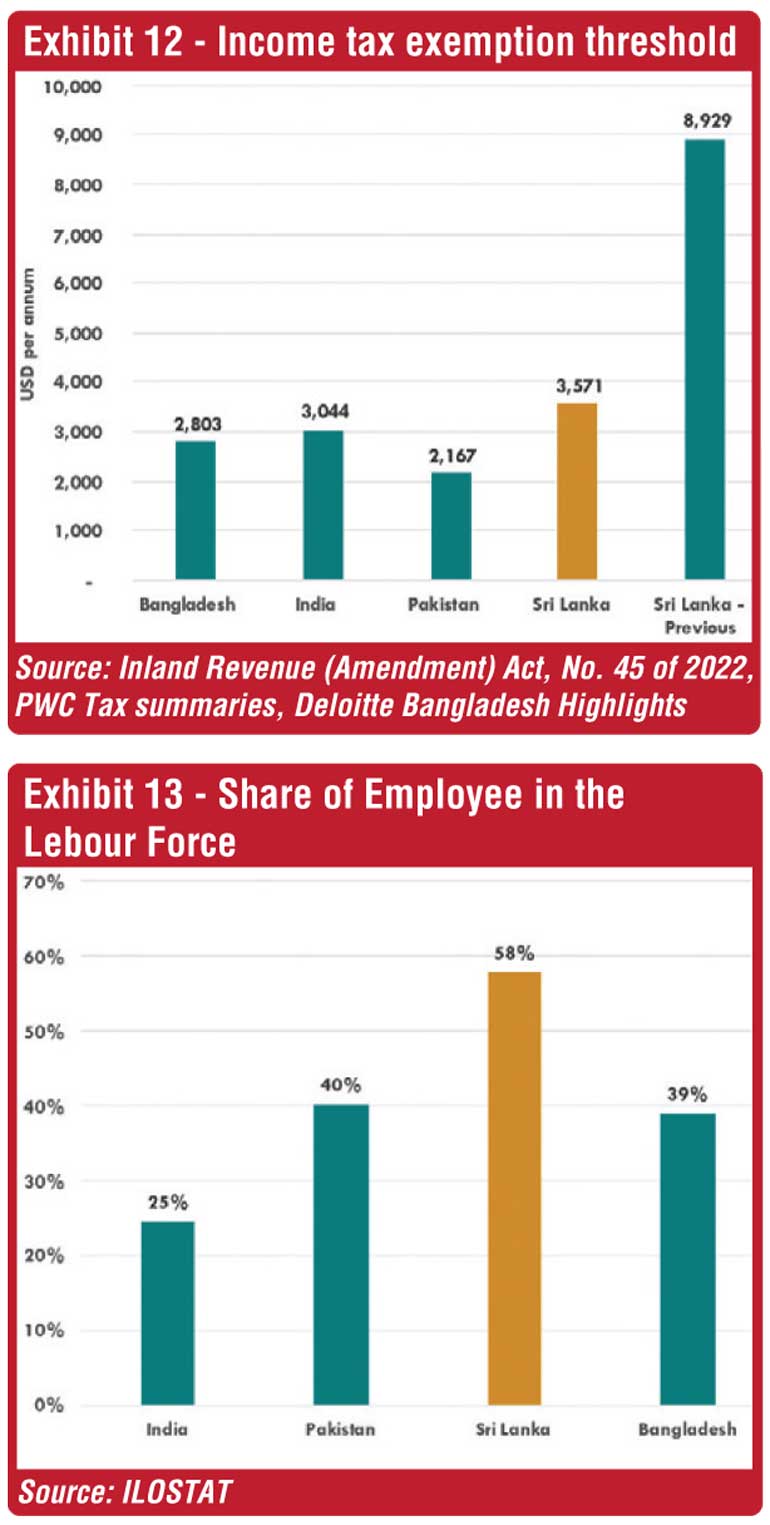
Compared to other South Asian nations, Sri Lanka has the highest threshold at $ 3,571. Countries such as India and Pakistan, have established their thresholds lower at $ 3,044 and $ 2,167, respectively (see Exhibit 12).
Based on Jensen (2022), it is important to determine the share of employees in the labour force at each income decile to properly enforce the tax. Sri Lanka has a higher proportion of its labour force as employees compared to other South Asian countries. Employees account for 58% of Sri Lanka’s labour force, whereas India, Bangladesh and Pakistan have lower than 40% of its labour force as employees (see Exhibit 13).
Sri Lanka has the capacity to tax a larger proportion of its population than India and other South Asian countries do. Information on income deciles for employees is valuable in determining the appropriate income group to include within the tax threshold. However, acquiring this data for Sri Lanka is currently challenging. With an average employee share of 58%, Sri Lanka could potentially levy income tax on the top 30% of its population. Sri Lanka’s exemption thresholds have anyway been closer to this level in the past.
It is also important that this threshold be adjusted regularly. The threshold should be established at a level that encompasses the majority of employees and should be adjusted downward as the country’s income increases, ultimately aiming to improve the tax base and ideally cover the entire population.
Moreover, the primary factor to consider when determining the threshold is the proportion of employees (in formal sector). There is no justification for granting relief to middle-income earners in the formal sector. In developed countries, tax thresholds are set to be very low or non-existent, with even minimum wage earners required to pay taxes. Assistance is then provided to the poor and the vulnerable based on their specific needs. However, due to the administrative costs of taxing everyone in developing nations, it is more prudent to exclude those in the informal sector who earn low wages.
Conclusion
Sri Lanka has one of the lowest global tax-to-GDP ratios, with personal income tax collection being notably low and decreasing as income increases. This pattern is in stark contrast to the increasing trends observed in other countries. Consequently, enhancing personal income tax revenue collection is crucial for Sri Lanka. To address this challenge, the Government has recently raised income tax rates and lowered the tax-free income threshold.
Sri Lanka’s newly introduced income tax rate surpasses that of its South and Southeast Asian income peers but is still below the optimal level. Hence, not excessively high, but still on the higher end compared to its income and regional peers. The country’s income tax exemption threshold is slightly higher than those of other South Asian countries. Given the larger proportion of employees in the workforce, Sri Lanka’s tax exemption threshold should encompass the top 30% of income earners, which it currently does. As the nation’s income improves, it will be essential to gradually adjust the threshold downwards. Having a lower threshold increases the tax base of the country leading to more revenue collection.
However, the Government must fulfil its role effectively. Wasteful spending of tax revenues collected from hard-working citizens is counterproductive. Massive public funds are often wasted on loss-making public enterprises, maintaining extensive defence budgets, and constructing large-scale public infrastructures with inflated costs through unsolicited proposals. While the Government makes prudent steps to improve revenue collection, it must simultaneously enhance its public finance management.
Furthermore, it is also the responsibility of the taxpayers and the public, in general, to make the Government more accountable in managing its funds. They must be aware that any mismanagement of public funds can lead to severe consequences. Either taxpayers bear the costs now or pass them on to future generations with interest (as has happened before and is no longer possible now) or face high inflation (due to money printing). Hence, taxpayers should actively participate in public finance management. One such way could be setting fiscal rules for the government to follow. For instance, the government did not comply with the FMRA for several years, essentially performing an unlawful act against its citizens. (Rajakulendran and de Mel, 2023). However, the public did not scrutinize the government for its actions. It is high time for both the government and the public to adopt a proactive stance in public finance management.
Lastly, enhanced tax revenue collection can help resolve Sri Lanka’s debt crisis, advance human capital development, and improve the quality of institutions. Most importantly, it can better the lives of the poor who are disproportionately affected by the crisis. In these challenging times, more fortunate individuals in society need to embrace tax reforms and contribute to the well-being of those in need. The top 30% of the population’s reluctance to pay taxes is highly unfair to the poorer citizens of the country.
References:
1. Besley, T. J., & Persson, T. (January 2013). Taxation and Development. CEPR Discussion Paper No. DP9307. Retrieved from https://ssrn.com/abstract=2210278
2. Central Bank of Sri Lanka. (Various years). Annual Report. Retrieved from https://www.cbsl.gov.lk/en/publications/economic-and-financial-reports/annual-reports
3. Deloitte. (2021, September). International Tax, Bangladesh Highlights. Retrieved from https://www2.deloitte.com/content/dam/Deloitte/global/Documents/Tax/dttl-taxbangladeshhighlights-2021.pdf
4. European Commission. (2020, October 29). Tax revenue: Overall tax-to-GDP ratio up to 41.1% of GDP in the EU in 2019 [PDF]. Eurostat. https://ec.europa.eu/eurostat/documents/2995521/11469100/2-29102020-BP-EN.pdf/059a7672-ed6d-f12c-2b0e-10ab4b34ed07
5. ILO Department of Statistics. (2022). Employment. ILOSTAT. Retrieved from https://ilostat.ilo.org/topics/employment/
6. Indraratna, Y. (2009). The Measurement of Tax Elasticity in Sri Lanka: A Time Series Approach. Staff Studies, 33(1), 73. https://doi.org/10.4038/ss.v33i1.1247
7. Inland Revenue Department. (2017). Income Tax Act №45 of 2022. Retrieved from http://www.ird.gov.lk/en/publications/Acts_Income%20Tax_2017/IR_Act_No._45_2022_E
8. Jensen, A. (2022). Employment Structure and the Rise of the Modern Tax System. American Economic Review, 112(1), 213–234. https://doi.org/10.1257/aer.20191528
9. Kleven, H. J., Kreiner, C. T., & Saez, E. (2016). Why Can Modern Governments Tax So Much? An Agency Model of Firms as Fiscal Intermediaries. Economica, 83(330), 219–246. https://doi.org/10.1111/ecca.12182
10. Lucas, R. E. (1988). On the mechanics of economic development. Journal of Monetary Economics, 22(1), 3–42. https://doi.org/10.1016/0304-3932(88)90168-7
11. Mirrlees, J. A. (1971). An exploration in the theory of optimum income taxation. The Review of Economic Studies, 38(2), 175–208.
12. Moore, M. (2017). Dwindling Tax Revenue: A Fiscal Puzzle. Tax Policy in Sri Lanka. Economic Perspectives’, Institute of Policy Studies, Colombo. Retrieved from https://www.ips.lk/wp-content/uploads/2017/10/Tax-Policy-in-Sri-Lanka-Economic-Perspectives_E_Book.pdf
13. OECD. (2022). Global Revenue Statistics Database. © OECD. Retrieved June 14, 2022, from https://stats.oecd.org/Index.aspx?DataSetCode=RS_GBL
14. Piketty, T., & Saez, E. (2013). Optimal Labor Income Taxation. Handbook of Public Economics, Vol. 5, 391–474. https://doi.org/10.1016/b978-0-444-53759-1.00007-8
15. Piketty, T., & Saez, E. (2013). Optimal Labor Income Taxation. Handbook of Public Economics, Vol. 5, 391–474. https://doi.org/10.1016/b978-0-444-53759-1.00007-8
16. Public Finance.lk (2020). Tax Revenue Categories. Public Finance Sri Lanka. Retrieved April 19, 2023, from https://publicfinance.lk/en/topics/tax-revenue-categories-1620676680.
17. Rajakulendran, R. P., & de Mel, N. (2023). Does Sri Lanka Need More Rules or Better Compliance? Public Finance. https://publicfinance.lk/en/topics/does-sri-lanka-need-more-rules-or-better-compliance-1678706814
18. Stiglitz, J. E., & Rosengard, J. K. (2015). Economics of the Public Sector (Fourth Edition). W. W. Norton & Company. (Paperback, 4th ed.)
19. WID - Wealth and Income Database. (2017, January 5). Data. WID - World Inequality Database. Retrieved from https://wid.world/data/
20. World Economic Outlook Database, April 2022. (2022). IMF. Retrieved June 14, 2022, from https://www.imf.org/en/Publications/WEO/weo-database/2022/April
21. Worldwide Tax Summaries Online. (2022). PWC. Retrieved June 14, 2022, from https://taxsummaries.pwc.com/
22. Department of Census and Statistics - Sri Lanka. (2023). National Accounts Estimates: Annual Provisional 2022. Retrieved April 19, 2023, from http://www.statistics.gov.lk/NationalAccounts/StaticalInformation/Reports/2022_Annual_Provisional
