Monday Feb 16, 2026
Monday Feb 16, 2026
Monday, 12 March 2018 00:00 - - {{hitsCtrl.values.hits}}
The World Economic Forum (WEF) website recently cited a Broadband Pricing League Table published by cable.co.uk. While the citation seems to lend the study credibility, the methodology behind the ranking is questionable (Source: lirneasia.net)
By Shazna Zuhyle
A Broadband Pricing League Table was recently released by cable.co.uk and subsequently cited in a post by an external contributor to the World Economic Forum (WEF). The original release highlights the most and least expensive countries for fixed broadband, and allows us to say with reference to an internationally acclaimed body (perceived superior), that Sri Lanka has the 17th least expensive broadband pricing in the world. The study however, is a case of comparing apples against oranges, and the methodology adopted by cable.co.uk is not comparable on a global scale. Here are a few reasons why.
Averaging multiple broadband plans skews prices
Averaging multiple plans on offer results in the price of broadband being highly skewed. As per the publicly available methodology notes, “the most basic package at each speed level” was selected. In some instances, it is typical for operators to advertise the theoretical maximum speed per technology.
Sri Lanka’s incumbent provider, Sri Lanka Telecom (SLT), advertises all ADSL plans with download speeds of “up to 21 Mbps” and all fiber-based plans with download speeds of “up to 100 Mbps”. The difference in price is vast. The most basic ADSL plan is Rs.450.00 (‘Web Light’, approx. $ 2.89 without tax) and the cheapest fiber-based package is Rs. 1490 (‘Web Family Plus’, approximately$ 9.57 without tax). Thus, entry-level pricing would be $ 2.89 (without taxes), but cable.co.uk reports this as $ 19.93.
If the purpose of the study is to compare entry-level prices, or, as the research analysts at cable.co.uk states, “the cost of getting online,” then why are prices being averaged?
When posed the question via email, consumer telecoms expert for cable.co.uk, Dan Howdle, said that various price points were averaged as there was no reasonable comparison for the “cost of entry”. However, a decision on what constitutes ‘entry level’ could have been reasonably drawn from the methodology adopted by the International Telecommunication Union (ITU). Plans that offer 1 GB/month at minimum speed, for example, would have made for a fair and more realistic comparison.
The exclusion of taxes
The methodology used does not address the tax issue explicitly – the data sheet and example that is publicly available have no mention of it. Ideally, the ranking would consider the actual cost incurred by the end consumer. Among South Asian countries alone, telecom tax percentages range from 0 to 32. This contributes significantly to the final price borne by consumers and ought to be factored in if meaningful comparisons are to be made on “the cost of getting online”.
Comparing dollar for dollar
The cost of a commodity in one country cannot be compared to the same commodity in another, based simply on dollar for dollar. The result would be highly misleading. Hence the need for principles such as purchasing power parity (PPP), the BigMac index, etc. The methodology adopted by cable.co.uk simply converts the average price of multiple fixed broadband plans on offer in each country to a USD value.
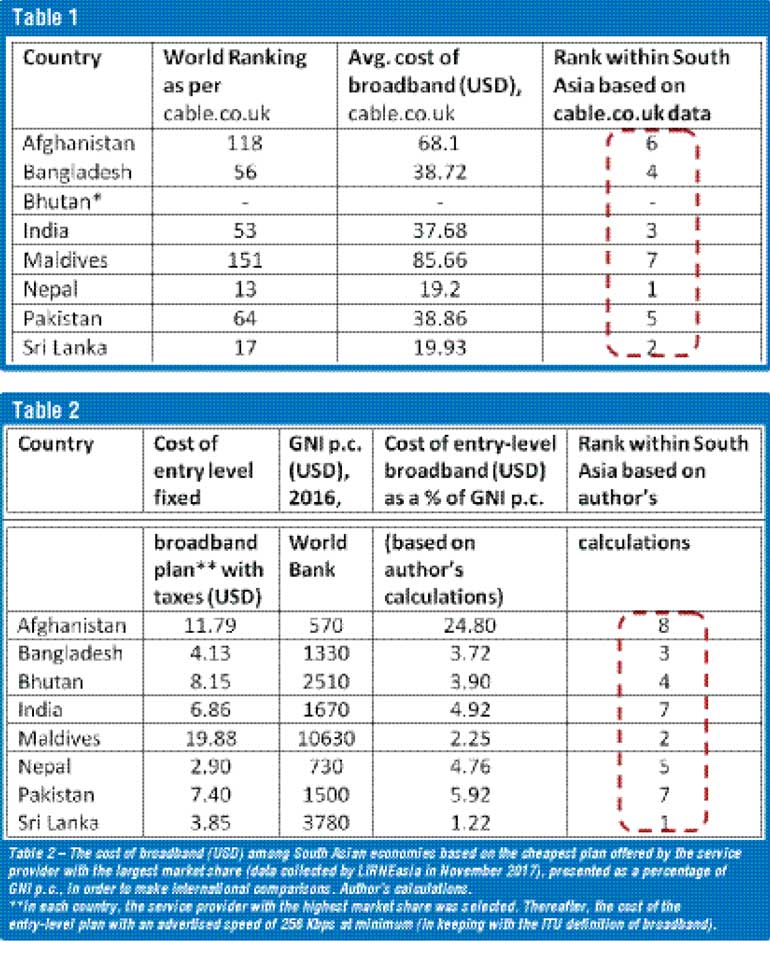
For further illustration see Table 1 which presents the cable.co.uk ranking of South Asian countries based on an average of various broadband prices. Accordingly, Nepal has the cheapest broadband in South Asia, followed by Sri Lanka.
Table 2 presents a ranking which uses slightly different methodology. The cost of entry-level broadband plans (one per country, based on what is offered by the service provider with the largest market share) is presented as a percentage of Gross National Income (GNI) per capita (World Bank, 2016, Atlas method). This method is adopted from the ITU ICT price basket methodology. The prices include the respective taxes in each country and are a better reflection of the cost incurred by consumers. This simple comparison levels the playing field and at least makes it fit for comparison on a global scale.
Through this method we see that Maldives (ranked by cable.co.uk as the most expensive in South Asia) has the second cheapest entry-level fixed broadband package among South Asian economies, after Sri Lanka which moves to the top. Nepal (which has the cheapest according to the cable.co.uk ranking) moves down to the fifth most costly in South Asia.
Indicators can be highly subjective and are often flawed because arriving at a one-size-fits-all composition is near impossible. Trade-offs are often made when designing indicators that would entertain a lesser or greater methodological flaw. In this case however, it is clear that there were measures that could have been taken to allow for a more realistic comparison that would have increased the legitimacy of the ranking. For more information on the cable.co.uk study and links to the article on the WEF site as well as an interactive map based on the country ranks, visit www.lirneasia.net.
(The author works on all things telecom at LIRNEasia, a pro-poor, pro-market ICT policy think-tank that works in South Asia and South East Asia. She has contributed to the ITU ICT Price Benchmarking since 2013 and recently led a committee within the ITU’s expert group for telecom/ICT on methodology. She holds an MSc in Telecommunications from University College London).


