Tuesday Apr 21, 2026
Tuesday Apr 21, 2026
Monday, 8 July 2019 00:00 - - {{hitsCtrl.values.hits}}
An article published in the Daily FT newspaper on 25/06/2019, under the heading ‘Baffling growth numbers of Census Department’ raises concerns regarding the National Accounts Estimates published for the first quarter of 2019 by the Department of Census and Statistics (DCS). The DCS issued the following statement to clarify:
Q1 growth rate accuracy
The economic growth rate is estimated not based on the previous quarter (quarter to quarter), it is computed based on the same quarter of the previous year (year on year). The reason behind this is the seasonal fluctuations of economic activities. Therefore it is not accurate to compute the growth rate compared to the previous quarter.
Accordingly, the growth rate of Q1 of 2019 was computed by comparing real GDP of Q1 of 2019 with the real GDP of Q1 of 2018 and not by comparing with real GDP of Q4 of 2018. According to the DCS estimates, in Q1 of 2019, the economy of Sri Lanka grew by 3.7% when compared to the first quarter of 2018. This estimate is based on a number of data sources, as recommended by international guidelines and methodologies. The DCS believes that the estimated growth rate for the first quarter of 2019 portrays an accurate picture of the economy.
The inflation rate confusion
To measure the inflation rate or the change in the total price levels of a country, it is common practice to use a Consumer Price Index (CPI). A CPI measures the rate of change in the price levels of consumer goods and services purchased by the consumers for their final consumption.The DCS uses the National Consumer Price Index (NCPI) as the official price index to measure the inflation of the country. Accordingly, the inflation rate computed for the first quarter of 2019 was 2.2%. (The inflation rate referred to by the author of the Daily FT article was derived by using the Colombo Consumer Price Index (CCPI) and hence differsfrom the official inflation figure. Inflation according to the CCPI for Q1 of 2019 was 4.0% and it is a much higher number than the official inflation of 2.2%.) 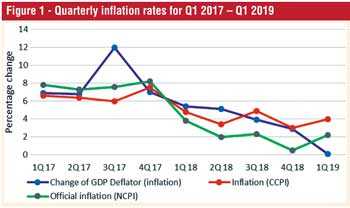
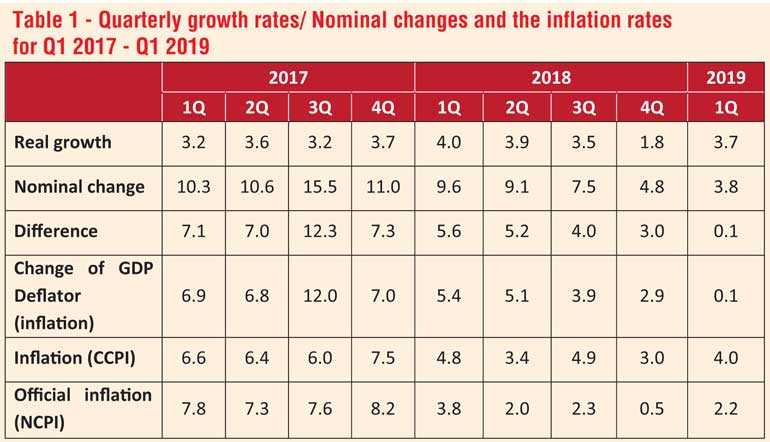
We have experienced a change in patterns and a significant change in the values of different inflation measures even in the past. The given table and the graph reflect it. For instance, when looking at the Q3 of 2017 point, there is a significant change in the measures of GDP deflator inflation rate and the NCPI and CCPI inflation rates.This kind of discrepancy (of results in two kinds of consumer price indices) is rare butpossible in any economy.
The GDP deflator, which is estimated as a ratio between current price GDP and constant price GDP, reflects the changes in price levels of total goods and services produced by the resident producers. However, the CPI shows only the changes in the price levels of consumer goods and services.The GDP deflator indicates the changes in the price levels of total goods and services produced within an economy. Accordingly, in addition to the consumer goods, the GDP deflator reflects price level changes due to the services provided by the government to the public, (national security, public administration, education, and free health services, etc.).
In addition, some economic activities like financial services and insurance services that do not have a market price, are reflected in the GDP deflator. Moreover, the price change in the net taxes on products which is a part of GDP is included in the GDP deflator too. Therefore the inflation computed by the GDP deflator and the inflation computed by the consumer price index may not be equal at one similar value. The inflation estimated by the CPI and the inflation estimated by the Producer Price Index (PPI) hence will not always be the same value. In Q1 of 2019, the inflation according to the NCPI is 2.2%; the increase in the PPI was just 1.7%.
The economic activities that factored in the decrease of the GDP deflator, are mainly agriculture activities, financial services, insurance services and net taxes on products. These activities have caused an increase in the current price GDP only by 3.8% in this quarter.
Inagriculture, the Gross Value Added (GVA) has fallen by 4.2% at current prices and GVA at constant prices has increased by 5.5%. Therefore the change in the deflator of agriculture activities recorded a negative value of 9.2% in this quarter. This kind of situation was experienced after 2014, in thefirst-quarter series. This indicates that the volume of agricultural products has increased, but their prices have declined. This is due to the decline in the producer prices of agricultural products.
In this quarter the producer prices of paddy, coconut, rubber, vegetables, fruits, and tea have declined heavily compared to the first quarter of 2018. Specifically, producer prices of paddy, coconut, rubber and tea have dropped down by 13.1%, 40.1%, 28.1% and 7.2% respectively. Therefore the Producer’s Price Index (PPI)for agriculture has reduced by 8.0% in the first quarter of 2019. This means compared to the first quarter of 2018, in the first quarter of 2019 the producer prices of agricultural products reduced by 8%. The high yield experienced in this quarter is another reason for this price reduction. It should be emphasised that even though the prices fell, the increase in production volume has a positive impact on the economic growth of the country.
Insurance, reinsurance and pension funds also reported a negative change in price. This can be explained by the decrease in profits and staff cost reported in this quarter. According to the official data of the Insurance Regulatory Commission of Sri Lanka (IRCSL), profit before tax decreased substantially by 67.6% during the Q1 of 2019.But according to the international practices and recommended guidelines of System of National Accounts (SNA 2008), the value-added at constant price should represent the extent to which clients have used insurance services.
There is an increase in value-added at the real price as the combination of premium earned and claims paid show significant increases in the use of insurance services. IRCSL also reports an 11.0% increase during this quarter. Accordingly, the deflator of insurance services has decreased by 51.1% in the first quarter of 2019 when compared to the first quarter of 2018. Similar to insurance services, value-addedin financial services in real terms has increased in more than nominal terms.
Under the new system, net taxes on products are a part of GDP. Taxes at nominal terms are the taxes collected by the government. But taxes at real terms is the taxable income that could have been collected in the respective quarter if it was charged at the same rates as the base year (2010). In the first quarter of 2019, taxes at real terms increased at a faster rate than the taxes at nominal rates. The Daily FT article notes that the demand for credit has dropped sharply. However, according to the official data of the Central Bank of Sri Lanka, there has been no clear reduction in the value of gross loans and advances offered by commercial banks. The article also states that there is a decrease in the corporate income of companies. This reduction has been caused by the marginal increase in nominal GDP. In summary, according to the National Consumer Price Index, Sri Lanka’s inflation is 2.2%, but that indicates only the change in the price level of consumer goods and services. The increase in the Producer’s Price Index (inflation) is 1.7% meaning that Sri Lanka’s price level has risen by only 1.7% from the producer’s point of view. According to the deflator change of GDP, Sri Lanka’s inflation in this quarter is 0.1% compared to the first quarter of 2018. This means that the prices of goods and services produced by Sri Lankan producers have increased by only 0.1% in this quarter compared to the relevant quarter of last year.
But real GDP measured in terms of production volume/capacity, rose 3.7% in the first quarter of 2019 compared to the first quarter of 2018. The department believes it is a real indicator that shows the current situation of the Sri Lankan economy.
The Department of Census and Statistics is constantly working to improve the accuracy of data used to estimate the national accounts. Its latest endeavour is the establishment of six task GDP forces representing public and private institutions to improve and strengthen the national GDP calculation mechanism.
To learn more about the preparation of national account estimates according to the new methodology, we invite you to visit our website http://www.statistics.gov.lk/national_accounts/dcsna_r2/production.php.

