Wednesday Jun 24, 2026
Wednesday Jun 24, 2026
Friday, 27 January 2023 00:00 - - {{hitsCtrl.values.hits}}
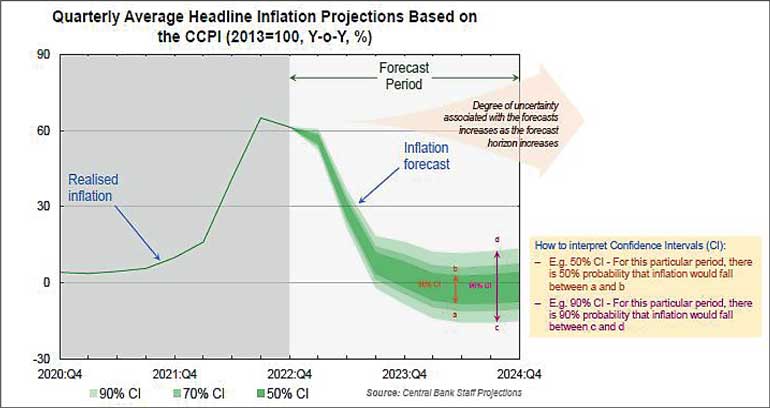
The Central Bank of Sri Lanka of late has been championing what is called the “Inflation Fan Chart” to support its forecast of country moving towards a single digit inflation by the year’s end. Following is an explanatory note by the CBSL.
A fan chart illustrates the uncertainty surrounding a forecast of a given macroeconomic variable.
The fan chart on inflation projections published by the Central Bank comprises realised inflation and projections in the form of confidence intervals.
Macroeconomic projections, including that of inflation, are done on a quarterly basis using a semi-structural macroeconomic model.
Quarterly data are used for this purpose and quarterly inflation is arrived at by averaging the three monthly observations of inflation (CCPI, y-o-y, published by the DCS) for a given quarter. The fan chart comprises forecasts arrived for these quarterly values of inflation.
Forecasts are arrived at using realised data, forecasts of major global indicators, near-term projections of selected variables and judgments. Accordingly, forecasts are uncertain by nature, which is represented by the confidence intervals, and this uncertainty needs to be taken into consideration when such forecasts are used for various purposes.
A confidence interval is a range of estimates for a parameter or variable (inflation, in the estimates under consideration). Accordingly, a 50% confidence interval is a range of values where one can be 50% confident that it contains the true value of the variable.

