Friday Mar 06, 2026
Friday Mar 06, 2026
Wednesday, 19 October 2016 00:01 - - {{hitsCtrl.values.hits}}
By Prabodha Agalawatte,
Lareef Zubair and Zeenas Yahiya
Notwithstanding the floods in mid-May over Sri Lanka, the rainfall from June to mid-October has been much less than usual, leading to a drought which has affected 625,000 people directly. Here, we quantify the drought and show that it (a) was severe in the Eastern and North-Central Provinces and moderate in other provinces; (b) was due to markedly low rainfall since May (c) its intensity compares with the initial phase of the major drought of 2013 and (d) it shall likely not be sustained for as long.
Which areas are most affected?
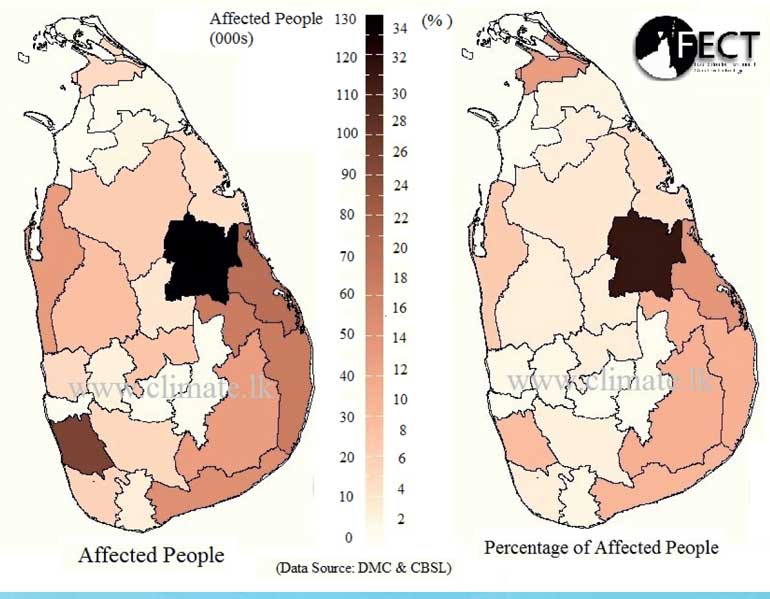
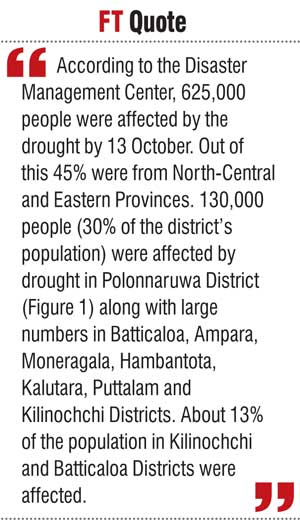
According to the Disaster Management Center, 625,000 people were affected by the drought by 13 October. Out of this 45% were from North-Central and Eastern Provinces. 130,000 people (30% of the district’s population) were affected by drought in Polonnaruwa District (Figure 1) along with large numbers in Batticaloa, Ampara, Moneragala, Hambantota, Kalutara, Puttalam and Kilinochchi Districts. About 13% of the population in Kilinochchi and Batticaloa Districts were affected.
 Impact on water storage
Notwithstanding the heavy May rainfall in the headstream areas, the reservoirs have been depleted more than is typical and below is a summary of storage in reservoirs used exclusively for irrigation and in addition for hydropower.
Irrigation reservoir storage: Most of the major reservoirs are filled to less than 50% of their respective capacities in mid-October. Water levels of many reservoirs have gone down significantly. The storage in most tanks in Ampara, Trincomalee, Moneragala, Anuradhapura and Polonnaruwa Districts has fallen below 35% of their capacity while storage in tanks in Batticaloa and Mannar districts have fallen below 20% and 10% respectively.
Reservoirs in the headstream and hydropower generation: Hydro reservoir storage capacity was at 86% at the beginning of 2016 and decreased steadily to 34% by April. Heavy rains in May filled up the reservoirs back up to 76%. By early-October, the capacity has once again come down to 51% (PUCSL). The contribution of CEB hydro power plants in May 2016 had been 33% of the total generation. This has come down to 15% in September 2016.
This Yala’s climate
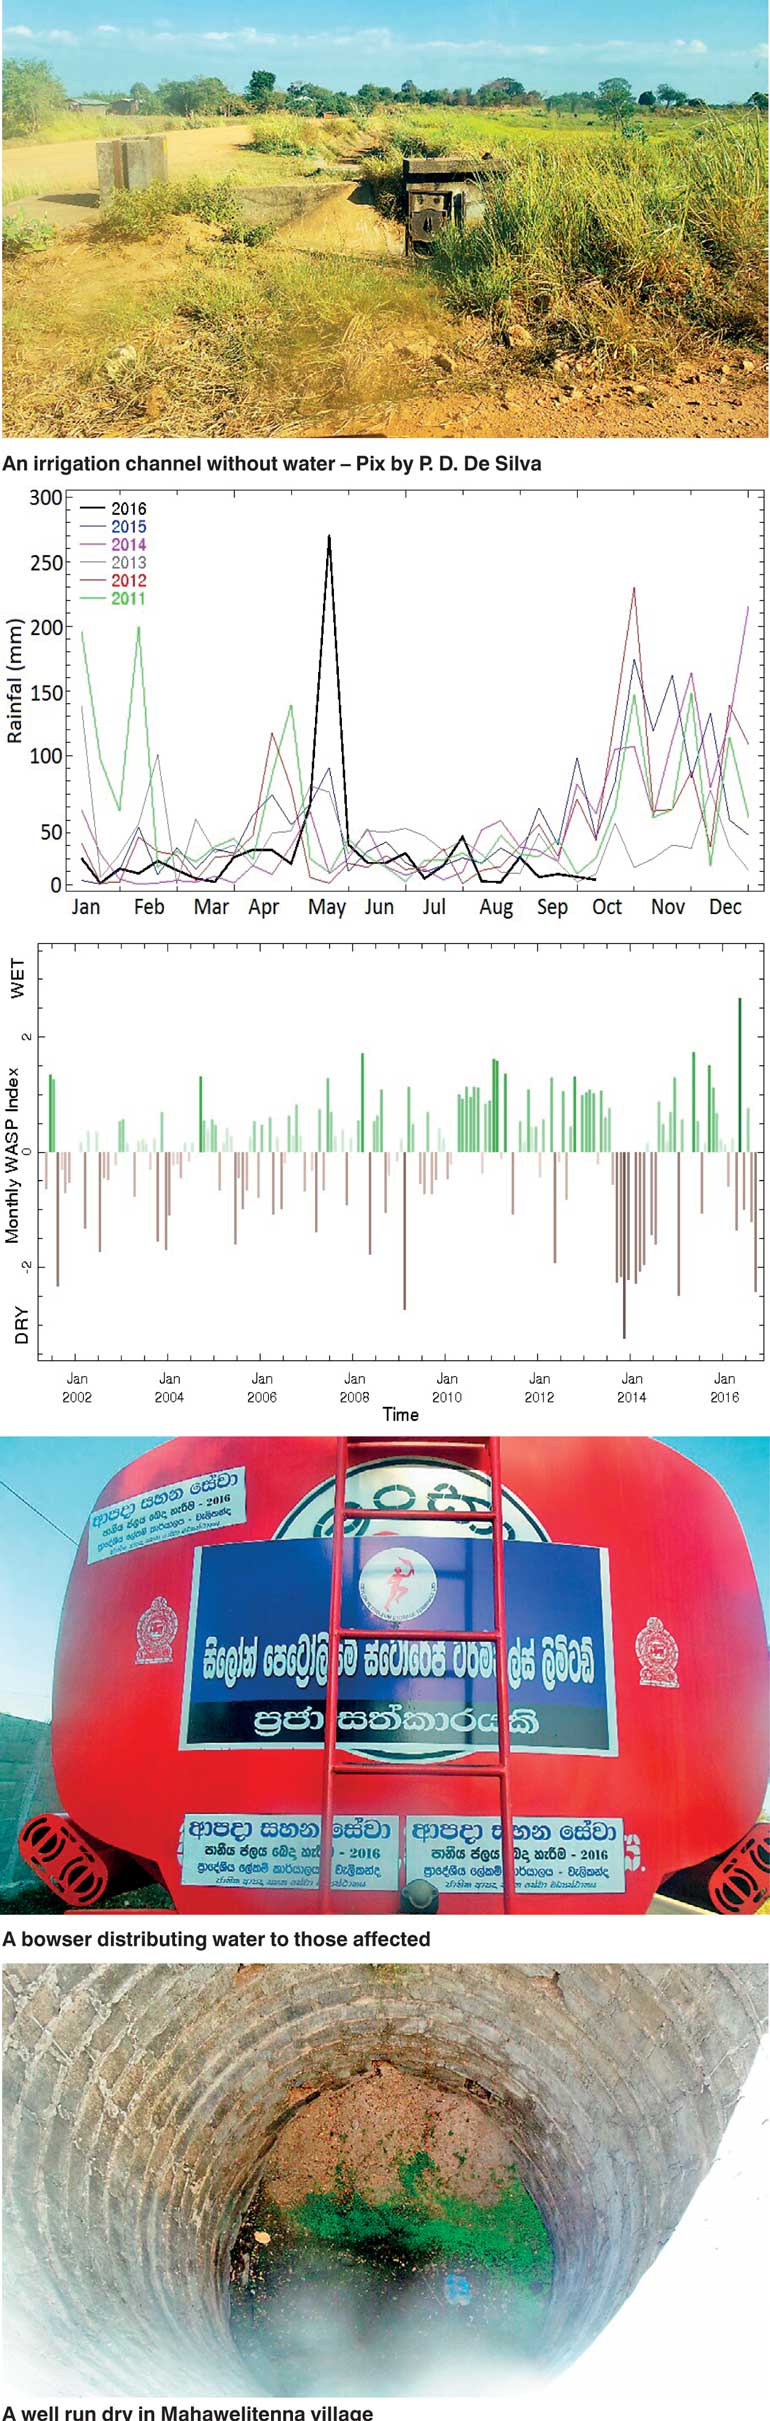
In the months leading into the Yala (April to September), rainfall was less than that in four out of five previous years (Figure 2). Then in mid-May heavy rainfall was received by the entire country and then relatively dry weather prevailed throughout the country until mid-October.
The rainfall deficit was made worse, as the temperature was at record levels this year, leading to a big rise in evaporation.
Measuring and monitoring drought
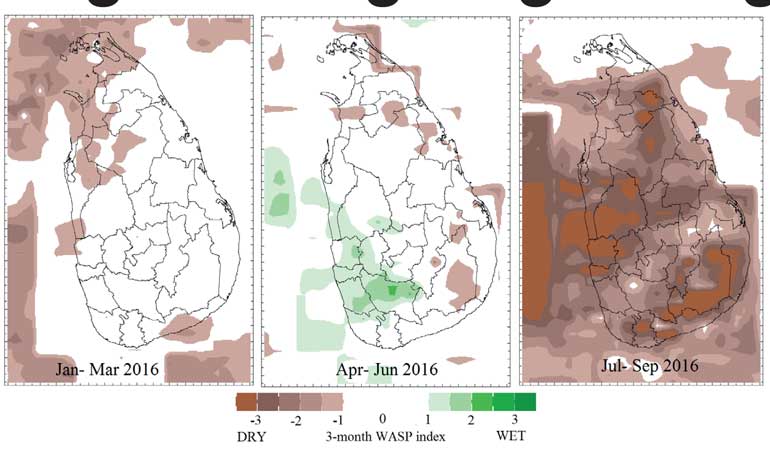
We have shown that the Weighted Anomaly Standardised Precipitation (WASP) Index is able to capture drought in Sri Lanka at fine-scale as captured by relief payments (Zubair et al., 2006, Lyon et al., 2009). This index just weights the deficits in each month by the rainfall that is expected and gives higher value to rainfall in the more recent months – given the seasonality of Sri Lanka, we use a three month period.
As see in maps of WASP indices in figure 3, conditions had been slightly dry in northern, north-western and south-western regions in the first quarter. In the second quarter, these dry conditions were mitigated by heavy rainfall in May. However, the rainfall deficits that began in June kicked on and in the third quarter extreme drought was established.
Polonnaruwa is one of the worst affected districts in the country. This can also be seen in the monthly WASP index for Polonnaruwa (Figure 4). September 2016 has been the fourth driest month in the last 15 years. It also shows that the most sustained and severe drought was the one in 2013-2014 and the present drought while severe is not as sustained yet.
Role of El Nino
From May 2015 El Niño conditions persisted for almost a year until May 2016. El Niño condition was one of the contributors to suppressed rainfall until April and to the May deluges. The tropical Pacific Sea Surface Temperature Anomaly is now at the threshold for a La Niña and La Niña conditions are likely to prevail in the coming months.
What is likely to follow?
Usually the period from October to December have the heaviest rainfall in Sri Lanka. Even though La Nina conditions typically lead to lower rainfall from October to December, it should still lead to relief from the drought as these are wet months even with a La Nina. However, the question is as to how soon the rains will arrive to provide relief in the drought-affected districts.
A separate question is whether there will be sufficient carryover storage to take care of the dry season after January. On this will ride the hydropower and agricultural productivity and water supply in Sri Lanka. At FECT (http://www.climate.lk), we provide a weekly update on these questions for those managing reservoirs and made available to the public via http://fectsl.blogspot.com and http://www.twitter.com/fectlk.
References
Lyon, B., Zubair, L., Ralapanawe, V. & Yahiya, Z., 2009. Finescale evaluation of drought in a tropical setting: case study in Sri Lanka. Journal of Applied Meteorology and Climatology, 48(1), pp. 77-88. Zubair, L., V. Ralapanawe, U. Tennakone, Z. Yahiya, and R. Perera (2006), Natural disaster risks in Sri Lanka: Mapping hazards and risk hotspots, Chapter 4, in Natural Disaster Hotspots Case Studies, Washington, DC: World Bank 2006.
(The writers are members of the Foundation for Environment, Climate and Technology, Kandy.)